
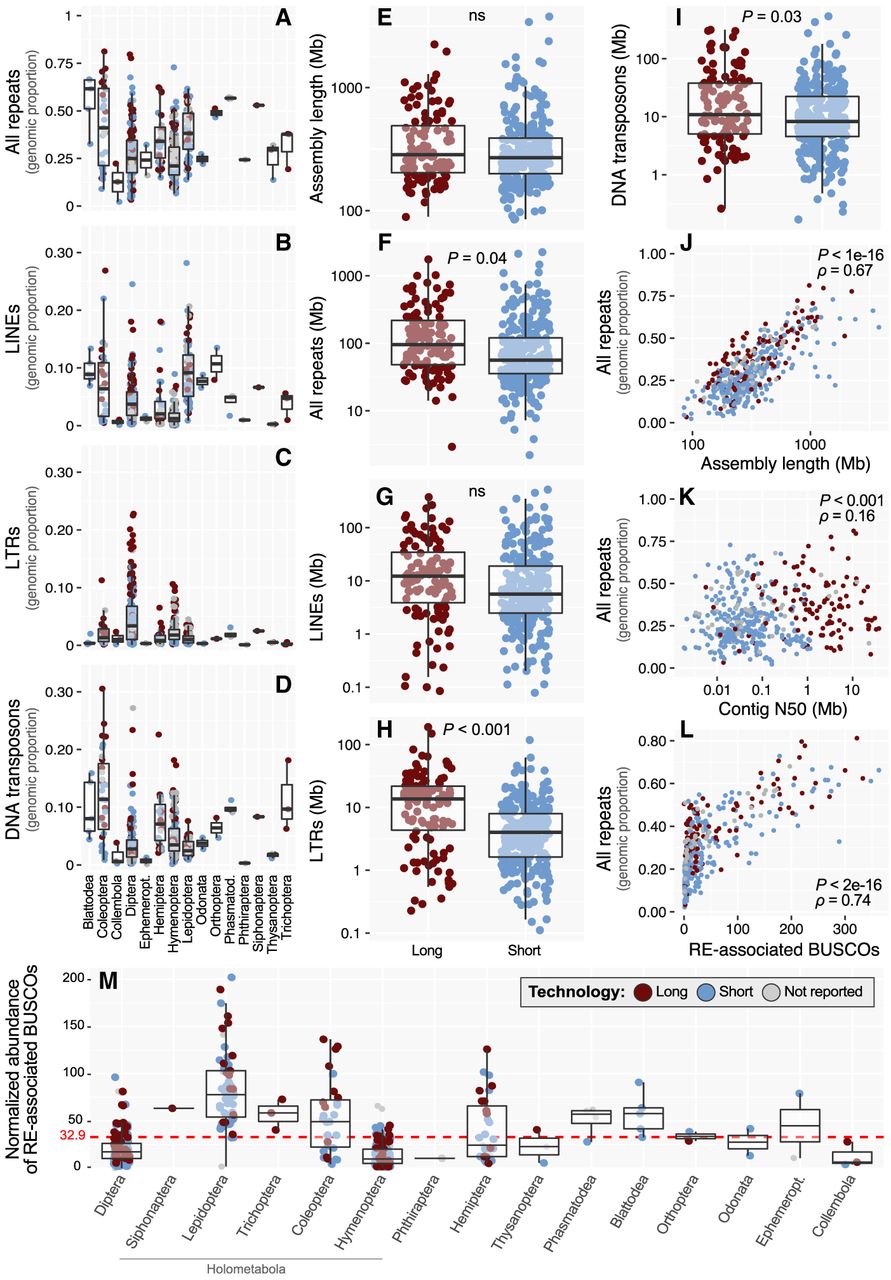
Statistical summaries of insect RE dynamics and technology impacts. (A–D) Genomic proportion of all repeats (A), LINEs (B), LTRs (C), and DNA transposons (D) across insect orders in the data set. Note that to improve visualization, y-axis scales differ between A and C,D. (E–I) Sequencing technology comparisons for assembly length (E), all repeats (F), LINEs (G), LTRs (H), and DNA transposons (I). Totals for DNA transposons reported include TIR, Crypton, and Helitron/Polinton elements, reflecting the classification scheme of RepeatMasker, although the large majority in all cases are TIR (for a finer breakdown of these three categories, see Supplemental Fig. S2). Significance was assessed with Welch two-sample t-tests. (ns) Not significant at P < 0.05. (J–L) Spearman's correlations between genomic proportion of repeats versus assembly length (J), contig N50 (K), and number of RE-associated BUSCO genes (L). (M) Normalized abundances of RE-associated BUSCOs across orders and organized by the phylogeny shown in Figure 1. For all plots, log-transformed data were used for visualization, whereas statistics were performed on the untransformed data.


