
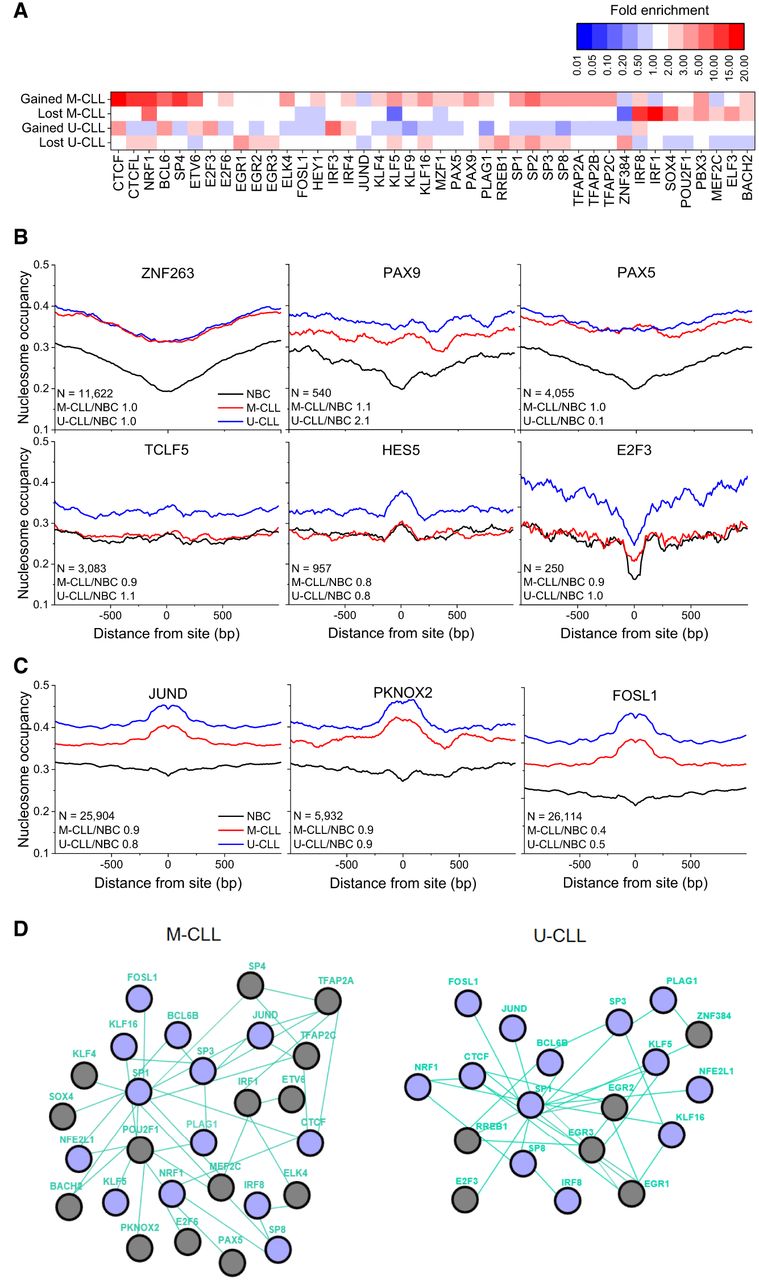
Analysis of TF binding in regions with differential nucleosome occupancy. (A) Heatmap showing fold-enrichment levels for TFs with more than twofold enrichment of their binding sites in regions that lost or gained nucleosomes in M-CLL or U-CLL versus NBCs or significantly changed the shape of their binding profile in CLL. (B) Nucleosome occupancy profiles around binding sites of TFs inside regions that lost ATAC-seq signal in CLL versus NBCs. (C) Nucleosome occupancy profiles around binding sites of TFs inside regions that gained ATAC-seq signal in CLL versus NBCs. The profiles are averaged over all NBC (black), M-CLL (red), and U-CLL (blue) samples. The number of regions (N) and fold expression change of the corresponding TF in two conditions, M-CLL versus NBC and U-CLL versus NBC, are indicated on the graph. (D) Nucleosome repositioning marks distinct TF pathways, which are different between M-CLL and U-CLL, whereas some network features remain common. Green TF connecting lines indicate known relationships of type “controls expression” based on Pathway Commons (http://www.pathwaycommons.org); purple circles, TFs affected both in U-CLL and M-CLL; and gray circles, TFs unique for CLL subtypes.


