
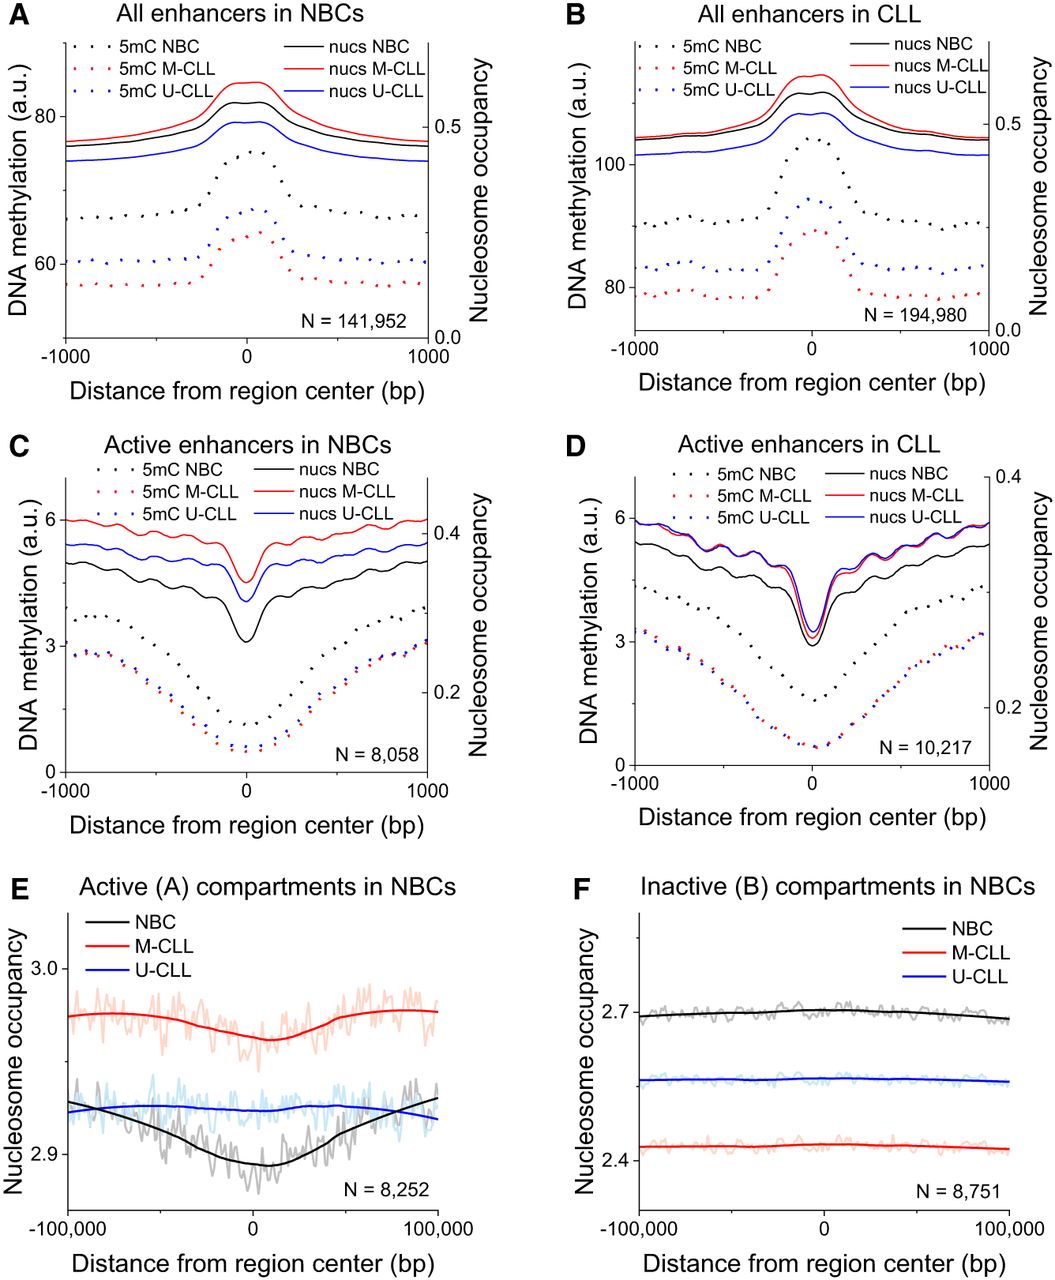
Average nucleosome occupancy and DNA methylation occupancy profiles at cis-regulatory elements. (A) Averaged nucleosome and DNA methylation occupancy profiles at enhancers in NBCs. (B) Same as panel A but for CLL. (C) Same as panel A but for active NBC enhancers as determined from ATAC-seq. (D) Same as panel C but for active CLL enhancer. (E) Averaged nucleosome occupancy profiles within the transcriptionally active A chromatin compartments determined from Hi-C in NBCs by Vilarrasa-Blasi et al. (2021). The profiles are averaged over all NBCs (black), M-CLL (red), and U-CLL (blue) samples. The number of regions (N) is indicated on the graphs. (F) Same as panel E but for the transcriptionally inactive B compartment.


