
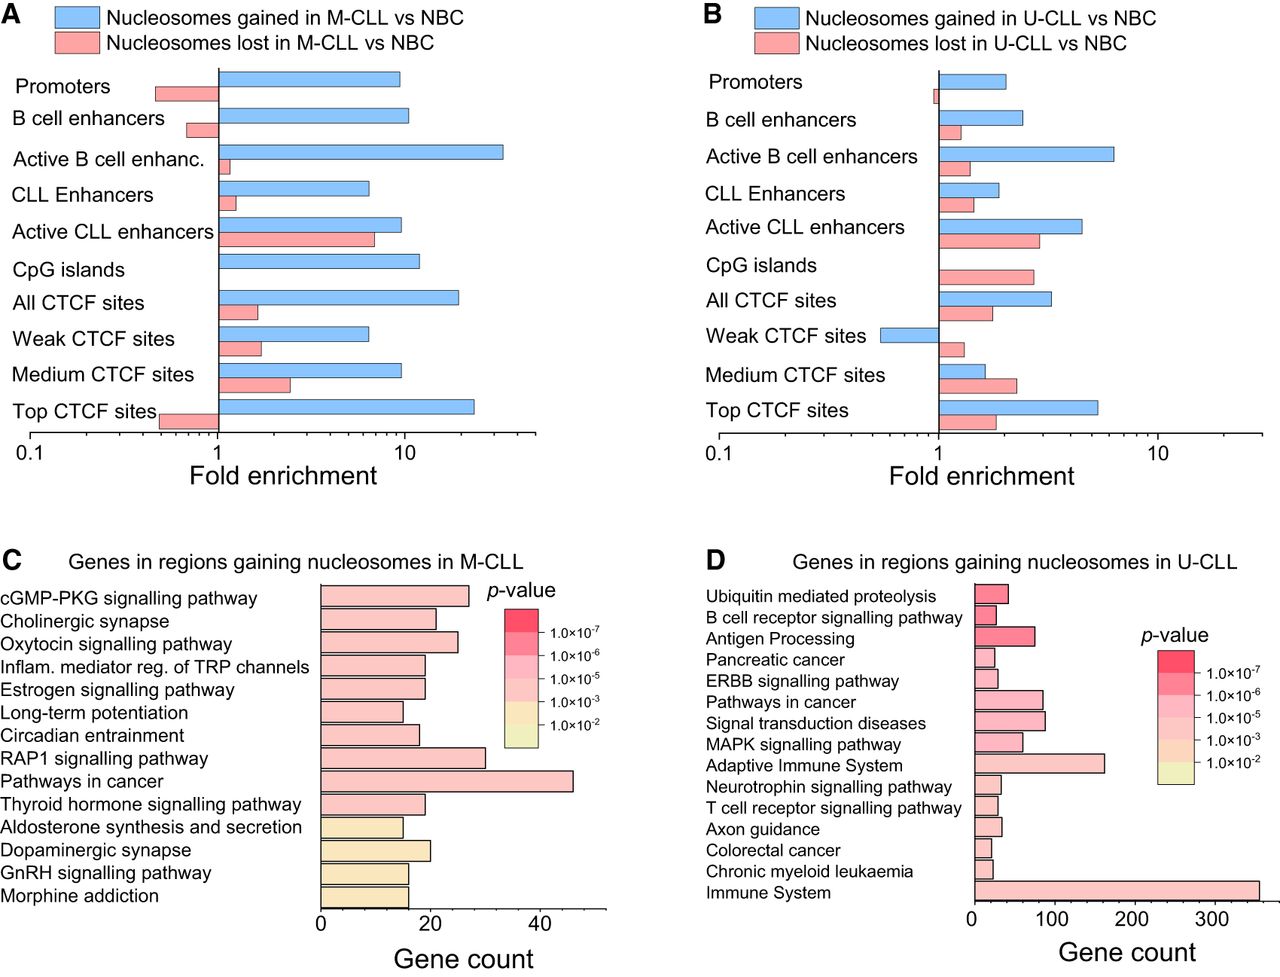
Figure 3.
Annotation of sites with differential nucleosome occupancy. (A) Genomic regions that lost (red) or gained (blue) nucleosomes in M-CLL versus NBC. (B) Same as panel A but for U-CLL versus NBC. (C) Gene Ontology analysis of genes that overlap with regions that gained nucleosomes in M-CLL versus NBC. (D) Same as panel C but for U-CLL versus NBC.


