
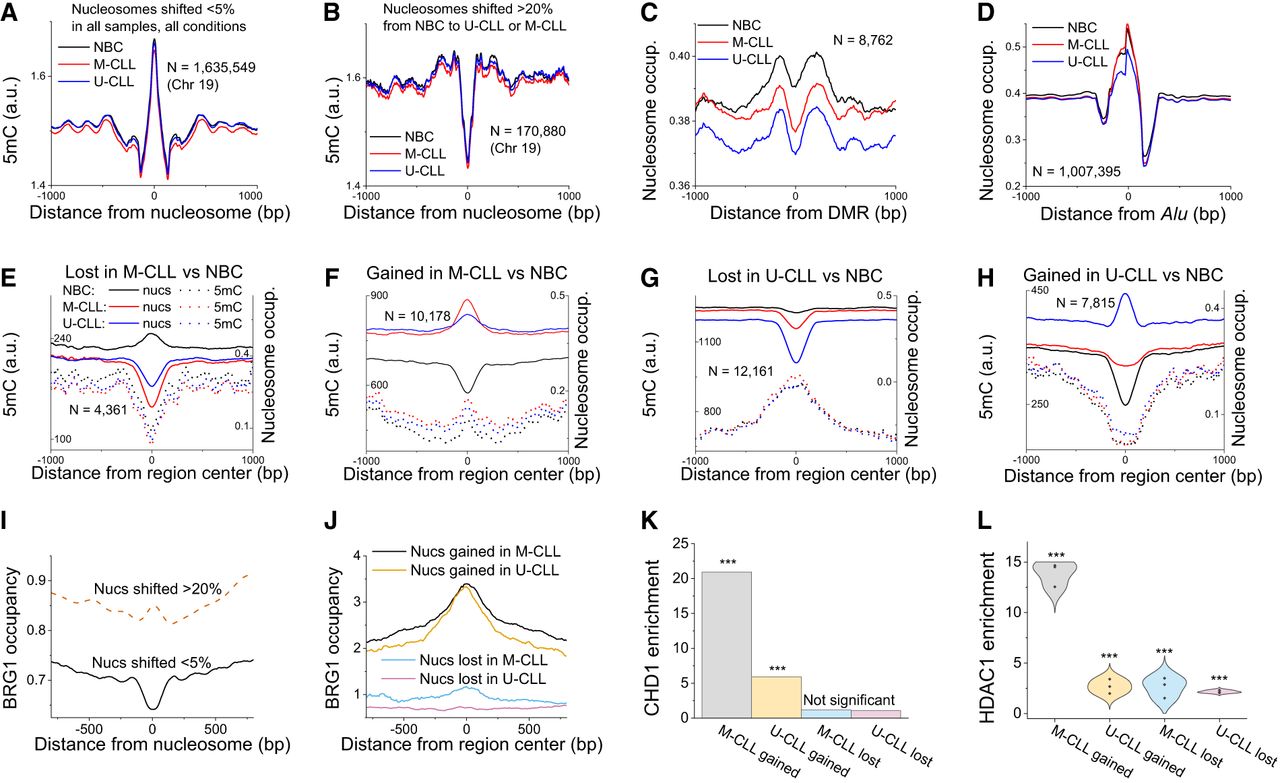
Mechanistic determinants of nucleosome repositioning in CLL. (A) DNA methylation occupancy profiles around centers of nucleosome-protected DNA fragments on Chromosome 19 for stable nucleosomes with an overlap between different sample types of >95%. (B) Same as panel A but for shifted nucleosomes. The overlap of positions between NBCs and CLL was <80%. (C) Nucleosome occupancy around DMRs with decreased DNA methylation in CLL versus NBCs. (D) Nucleosome occupancy around Alu repeats. (E) Averaged nucleosome occupancy (solid lines) and DNA methylation profiles (dashed lines) around centers of 100-bp regions with decreased nucleosome occupancy (lost nucleosomes) in M-CLL versus NBCs. The profiles of nucleosome occupancy (solid lines) and DNA methylation (dashed lines) were averaged across all NBCs (black), M-CLL (red), and U-CLL (blue) samples. The number of regions used in the calculation (N) is indicated on the graph. (F) Same as panel E but for regions with increased nucleosome occupancy (gained nucleosomes). (G) Same as panel E but for regions with decreased nucleosome occupancy in U-CLL versus NBCs. (H) Same as panel G but for regions with increased nucleosome occupancy. (I) BRG1 occupancy in NBCs around centers of stable and shifted nucleosomes at the same regions shown in panel A. (J) BRG1 occupancy in NBCs around regions that lost or gained nucleosomes in CLL versus NBCs for the same regions shown in panels E–H. (K) Enrichment of CHD1 ChIP-seq peaks determined in the lymphoblastoid cell line GM12878 inside regions that undergo nucleosome loss/gain in CLL versus NBCs. (L) Enrichment of HDAC1 ChIP-seq peaks determined in peripheral blood mononuclear cells from CLL patients with a 11q deletion genotype (GSE216287) inside regions that undergo nucleosome loss/gain in CLL versus NBCs. The violin plots correspond to the distribution based on three ChIP-seq replicates. Fisher's test, P < 10 × 10−3 for all points.


