
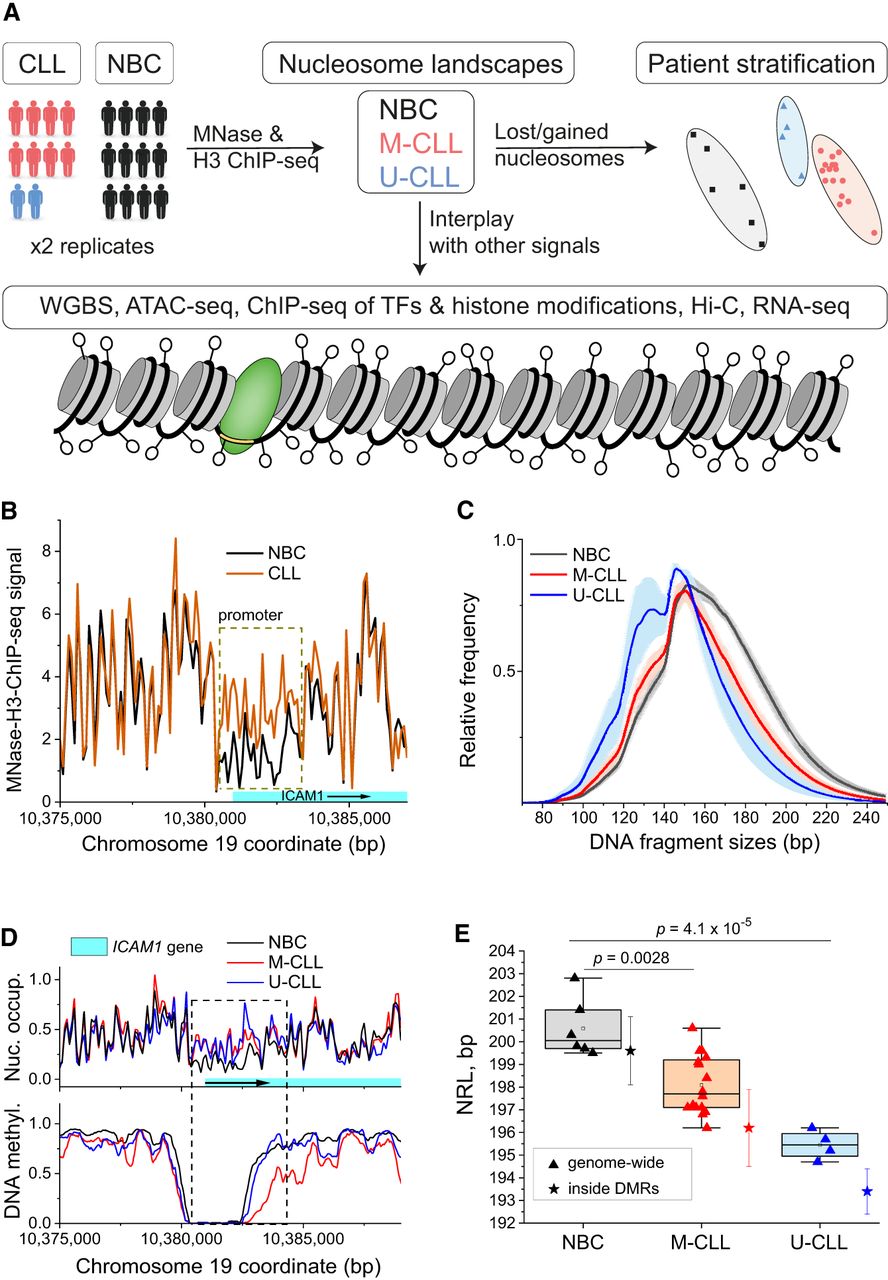
Changes of nucleosome positioning between NBCs, M-CLL, and U-CLL. (A) Data sets and readouts. Nucleosome landscapes were derived from MNase-assisted H3 ChIP-seq for nonmalignant B cells (NBCs) from healthy donors or CLL patients stratified into IGHV-mutated (M-CLL) or unmutated (U-CLL). These maps were integrated with data from WGBS, ATAC-seq, ChIP-seq of transcription factors (TFs) and six histone modifications, Hi-C, and RNA-seq to dissect molecular mechanisms of nucleosome repositioning. (B) Nucleosome occupancy maps in NBCs and CLL at a genomic region enclosing the promoter of the gene ICAM1. Gene expression of ICAM1 was 10-fold reduced in CLL. The total signal of MNase-assisted H3 ChIP-seq is used without size selection of DNA fragments. (C) Distributions of DNA fragment sizes from MNase-assisted H3 ChIP-seq in NBCs, M-CLL, and U-CLL. (D) Nucleosome occupancy and DNA methylation for the same region as in panel B but using only 120- to 180-bp-sized DNA fragments. (E) Genome-wide nucleosome repeat length (NRL). A decrease from ∼200 bp in NBCs (black) to ∼198 bp in M-CLL (red) to ∼195 bp in U-CLL (blue) is apparent. Each triangle symbol corresponds to one biological sample. Colored boxes indicate 25%–75% confidence interval; whiskers, range within 1.5 IQR; horizontal line, median; and open squares, mean values. Values inside DMRs shown by asterisk symbols correspond to cohort averages for NBCs (black), M-CLL (red), and U-CLL (blue), with vertical bars depicting the standard deviation.


