
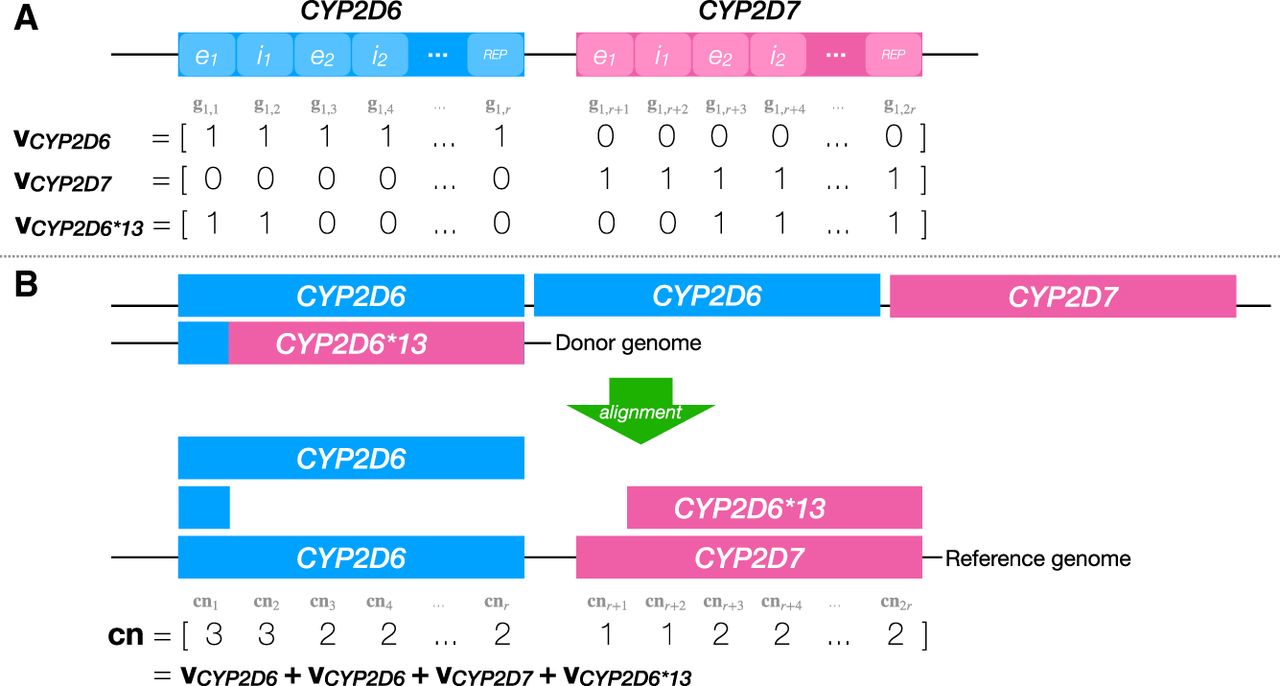
Figure 2.
A sample decomposition of aggregate coverage into individual structural configurations. (A) An example database of CYP2D6 structural configurations containing three such configurations (vCYP2D6, vCYP2D7, and vCYP2D6*13). Regions on top of the configurations that were defined (i.e., e1, i1, etc.) are shaded with lighter color. In this example, vCYP2D6 corresponds to the g1. (B) Sample decomposition of the aggregate coverage vector cn, observed after aligning the reads originating from the donor genome (above) to the reference genome (below). As can be seen, cn can be expressed as the sum of four structural configuration vectors from the database.


