
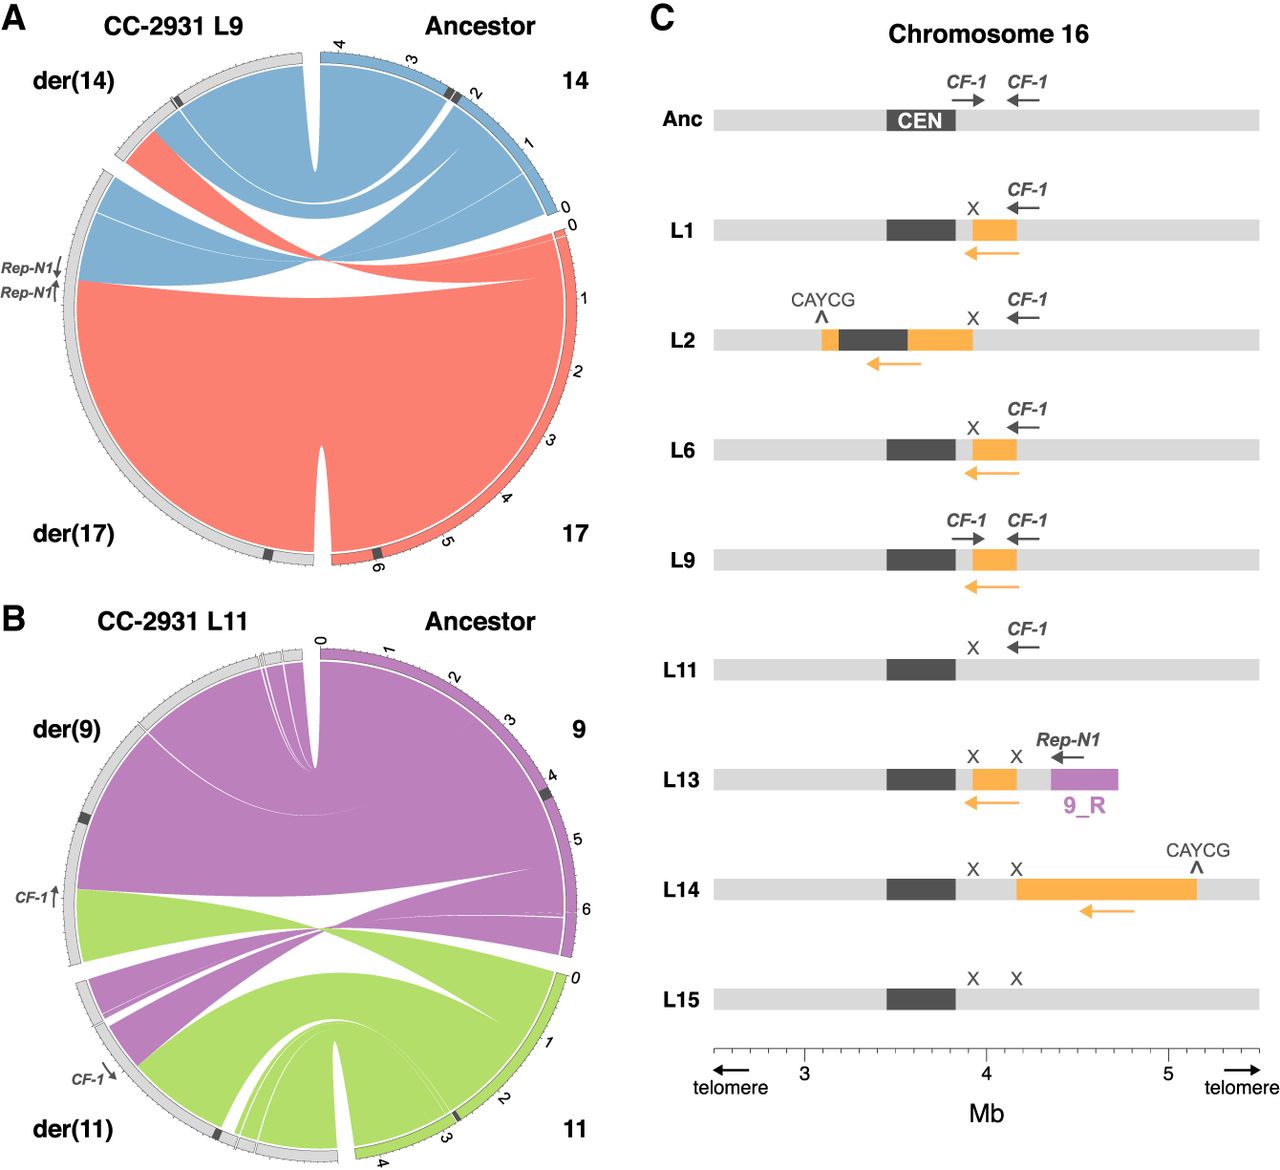
Genomic rearrangements mediated by TEs. Translocations in CC-2931 MA lines 9 (A) and 11 (B). The ancestor chromosomes are represented on the right half of each Circos plot (Krzywinski et al. 2009), whereas the MA line chromosomes (as contigs) are on the left. Chromosome numbers are given for the ancestor, and derived chromosomes (denoted by “der”) are provided for the MA lines based on centromere annotation (dark gray regions). Scale is in megabases. CF-1 indicates CryptonF-1_cRei insertions; Rep-N1 indicates Replitron-N1. The direction of the arrows indicates the left to right orientation of the TE sequence. (C) CryptonF-1_cRei (CF-1)-mediated inversions on Chromosome 16 in CC-2931 MA lines. Ancestor and MA line genomes are shown from top to bottom. The dark gray region represents the centromere, and the orange blocks represent inversions. The purple region in L13 shows a Replitron-N1-mediated translocation with Chromosome 9. Gray arrows indicate the orientation of CryptonF-1_cRei from left to right, and “X” indicates CryptonF-1_cRei excisions.


