
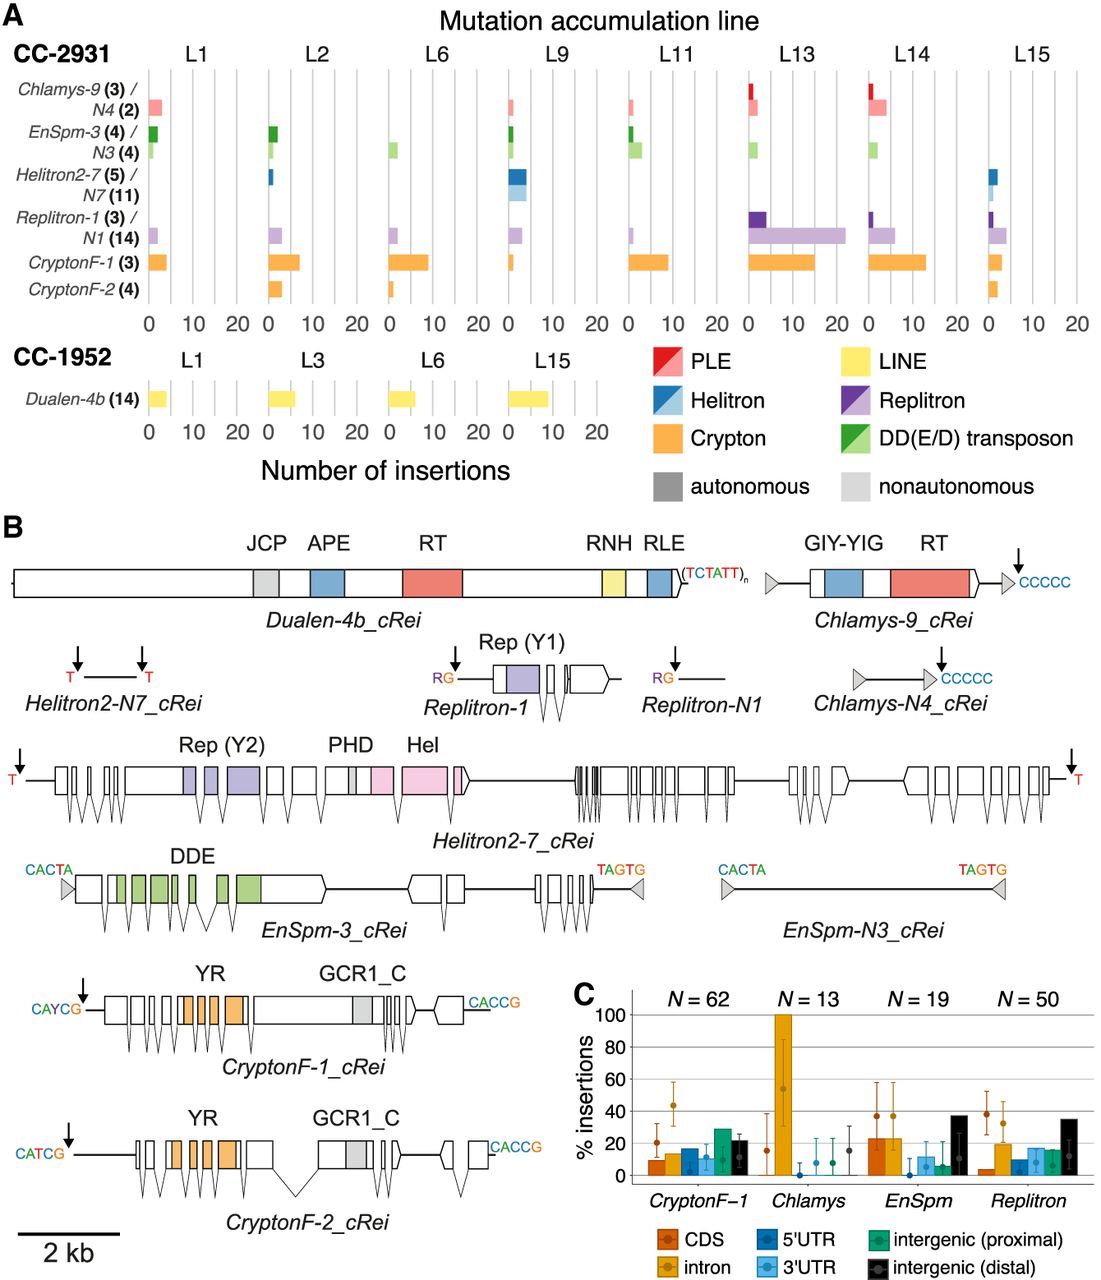
Active TEs. (A) Number of insertions per TE family per MA line. Families with less than two insertions per strain are not shown. TE subclasses are shown in colors (red: PLE; yellow: LINE; blue: Helitron; purple: Replitron; orange: Crypton; green: DD(E/D) transposon). Autonomous (darker colors) and nonautonomous (lighter colors) families putatively relying on the same transposition machinery are grouped. The prefix of each TE name denotes the superfamily. Numbers in parentheses and bold indicate the number of ancestral copies of each TE family. (B) Schematics of active TE families (to scale). Terminal inverted or direct repeats are shown by gray arrows, terminal sequences are shown above the main TE bodies (solid black lines), and insertion targets are shown next to black arrows. Coding sequence and introns of genes are shown by blocks and connecting lines, with domains colored. (RT) reverse transcriptase; (GIY-YIG) GIY-YIG endonuclease; (RNH) Ribonuclease H; (APE) apurinic/apyrimidinic endonuclease-like endonuclease; (RLE) restriction-like endonuclease; (JCP) Josephin-related cysteine protease; (Rep) replication protein (HUH endonuclease); (Hel) helicase; (PHD) plant homeodomain finger; (DDE) DDE transposase; (YR) tyrosine recombinase; (GCR1_C) DNA-binding domain. (C) Distribution of specific TE family insertions relative to genomic annotations in CC-2931. Autonomous and nonautonomous pairs were considered together. Error bars show the expectation based on the random sampling of TE insertions, with 1000 replicates per TE insertion (see Fig. 3). Here, the sampling process was adjusted for the genomic distribution of family-specific target sequences (see panel B).


