
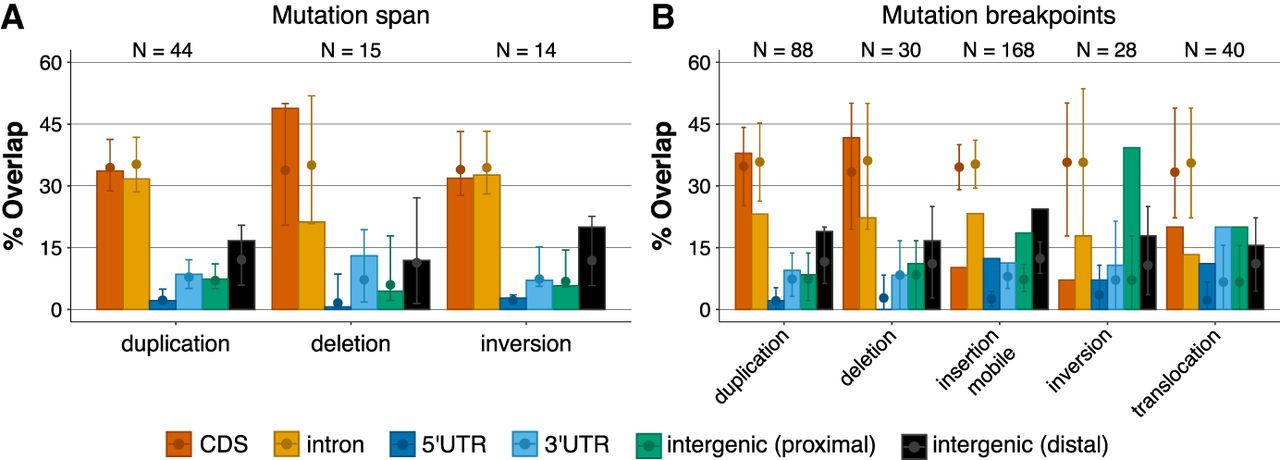
SM genomic distribution. (A) Overlap of SMs with genome annotations. Colored vertical bars represent the overlap between different functional annotations (in colors) and types of SM. The expected overlap was then estimated after the sampling of randomly distributed SMs of the same length, using 1000 replicates. Closed circles represent the median expected overlap of SMs with functional annotations, and error bars represent the corresponding 95% confidence intervals. (B) Distribution of SM breakpoint coordinates (start and end) relative to genomic annotations. The expected overlap of SM breakpoint coordinates with functional annotation was estimated as in panel A, that is, from random sampling of genomic coordinates. Note that the number of observations is twice that in panel A because the mutations have two breakpoints (except for mobile insertions).


