
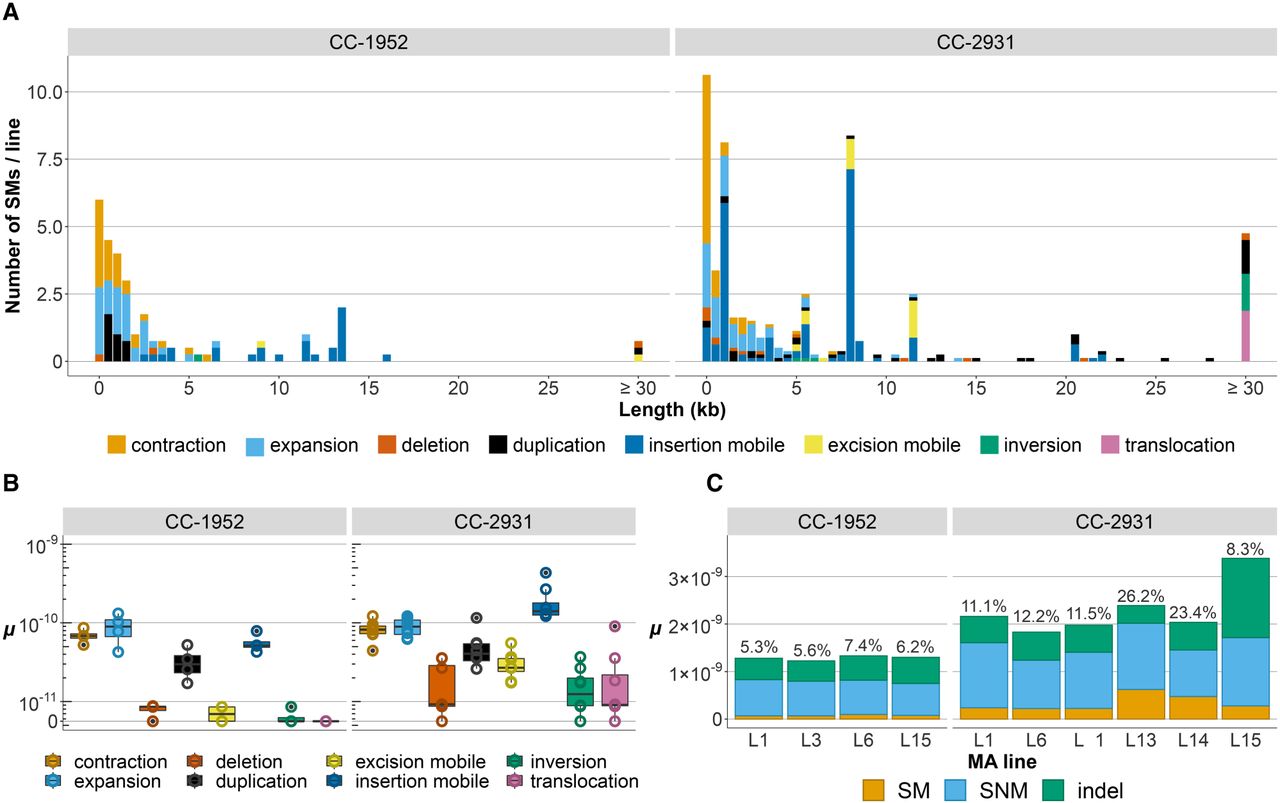
Spectra and rates of SMs. (A) Mean number of SMs by type (in colors) and length (in kilobases, rounded to 0.5 kb) per MA line. A total of five uncharacterized rearrangements of unknown length in CC-2931 MA lines are excluded. (B) The SM rate per site per generation (μ, on a log10 scale) is plotted as open points and boxplots for different types of SMs. Data points represent individual MA lines. Supplemental Figure S5 provides an analogous plot showing per genome per generation SM rates. (C) Mutation rates for different mutation types across the CC-1952 and CC-2931 MA lines, after excluding mutations in tandem repeat annotations. Only lines sequenced by PacBio HiFi are included. The percentage at the top of the bar indicates the proportion of SMs relative to all mutation types (SMs, SNMs, and indels).


