
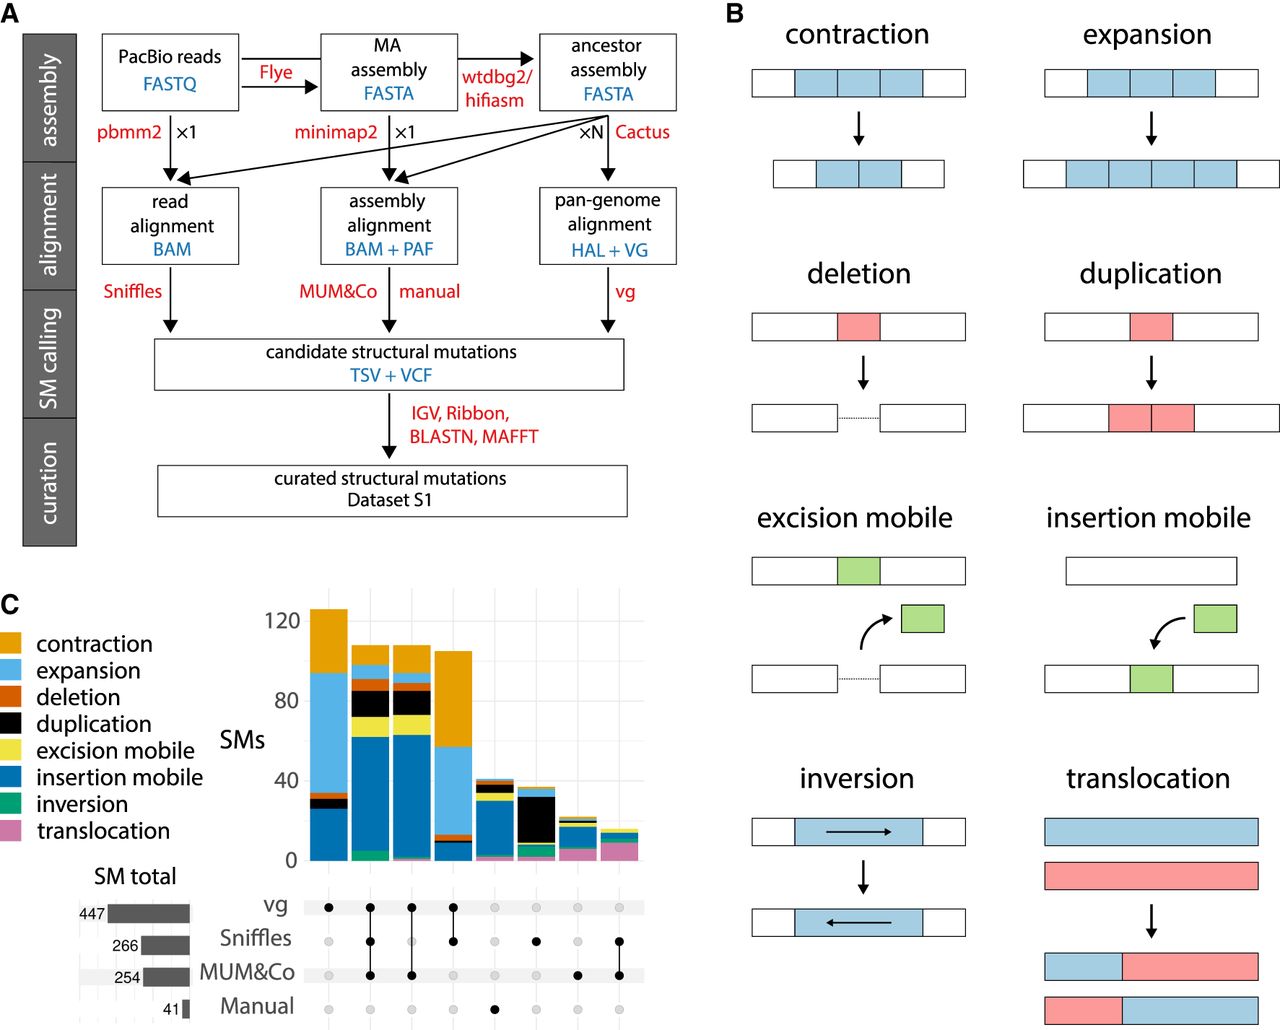
Structural mutation (SM) detection. (A) Flowchart of the SM calling pipeline. Steps are organized from top to bottom in four stages: genome assembly, mapping and alignment, SM calling, and SM curation. The software used in each step is shown in red text, and file formats are in blue text. “Manual” indicates variants that were curated directly from alignment files. “×1” indicates that each data set (reads or assemblies) was analyzed individually; “×N” indicates that all MA lines for a given strain were analyzed collectively. (B) Schematics illustrating the eight different types of SM called. The ancestral state is shown above; the mutated state, below. (C) Intersection of the number of curated SMs identified by each calling method across all MA lines (for the two strains, CC-1952 and CC-2931, combined). In vertical bars, the numbers of SMs are colored by SM type. Horizontal bars (in gray) show the total numbers of SMs called by each method.


