
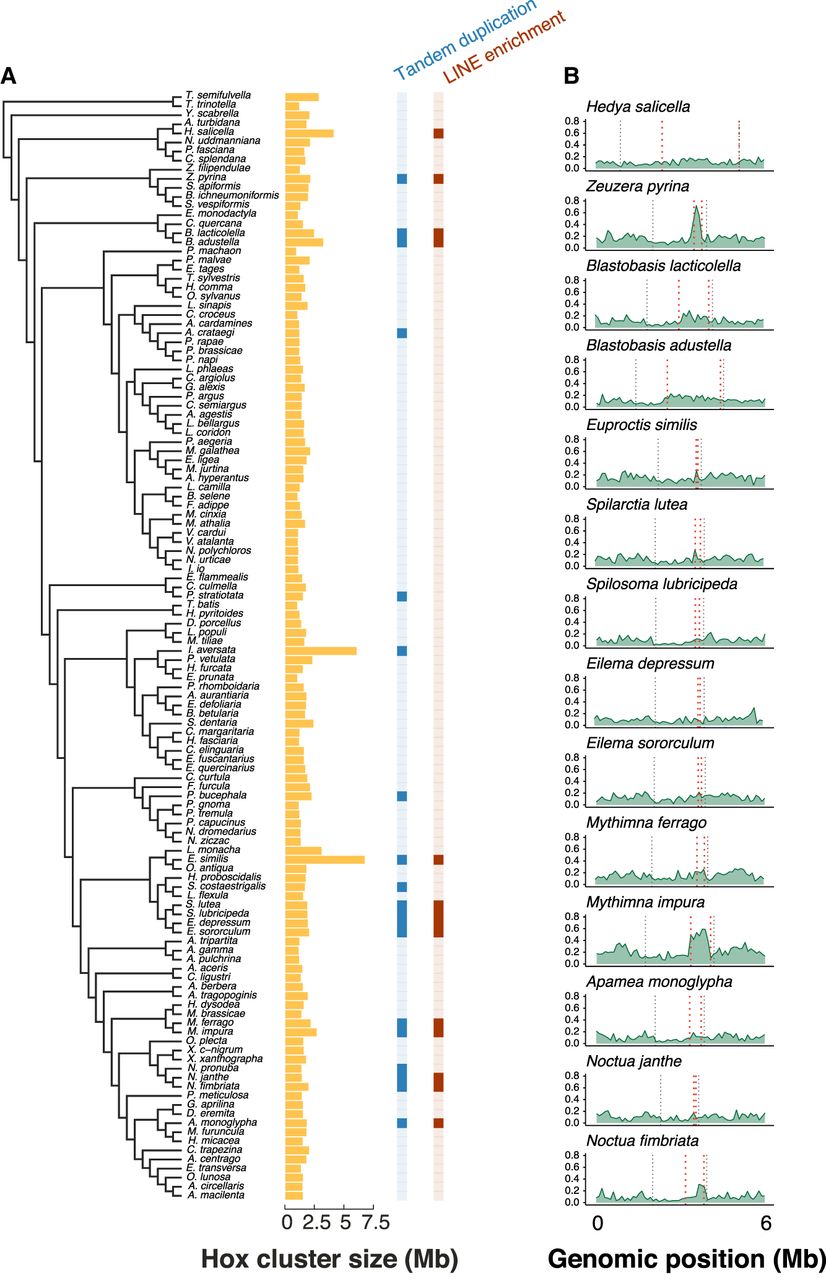
Association between increased LINE density and extensive tandem duplication of Shx genes. (A) Left shows the species tree of 122 Lepidoptera species. Bar chart in yellow corresponds to the length of the Hox cluster (excluding labial) for each species in the tree measured in Megabases. The column in blue indicates those species with large tandem duplications of Shx genes in the Hox cluster (dark blue) or those with a “normal” number of Shx genes (light blue). The column in red indicates species with significantly enriched density of LINE elements (dark red) within the region containing the Shx genes. (B) LINE density plot across the Hox cluster plus 3 Mb either side; this is shown for 14 species with enriched LINE density in the region containing Shx genes. The outer black dashed lines represent the edges of the Hox cluster (Abd-B to ro), and the inner red dashed lines represent the edges of the Shx genes (ShxD to ShxA).


