
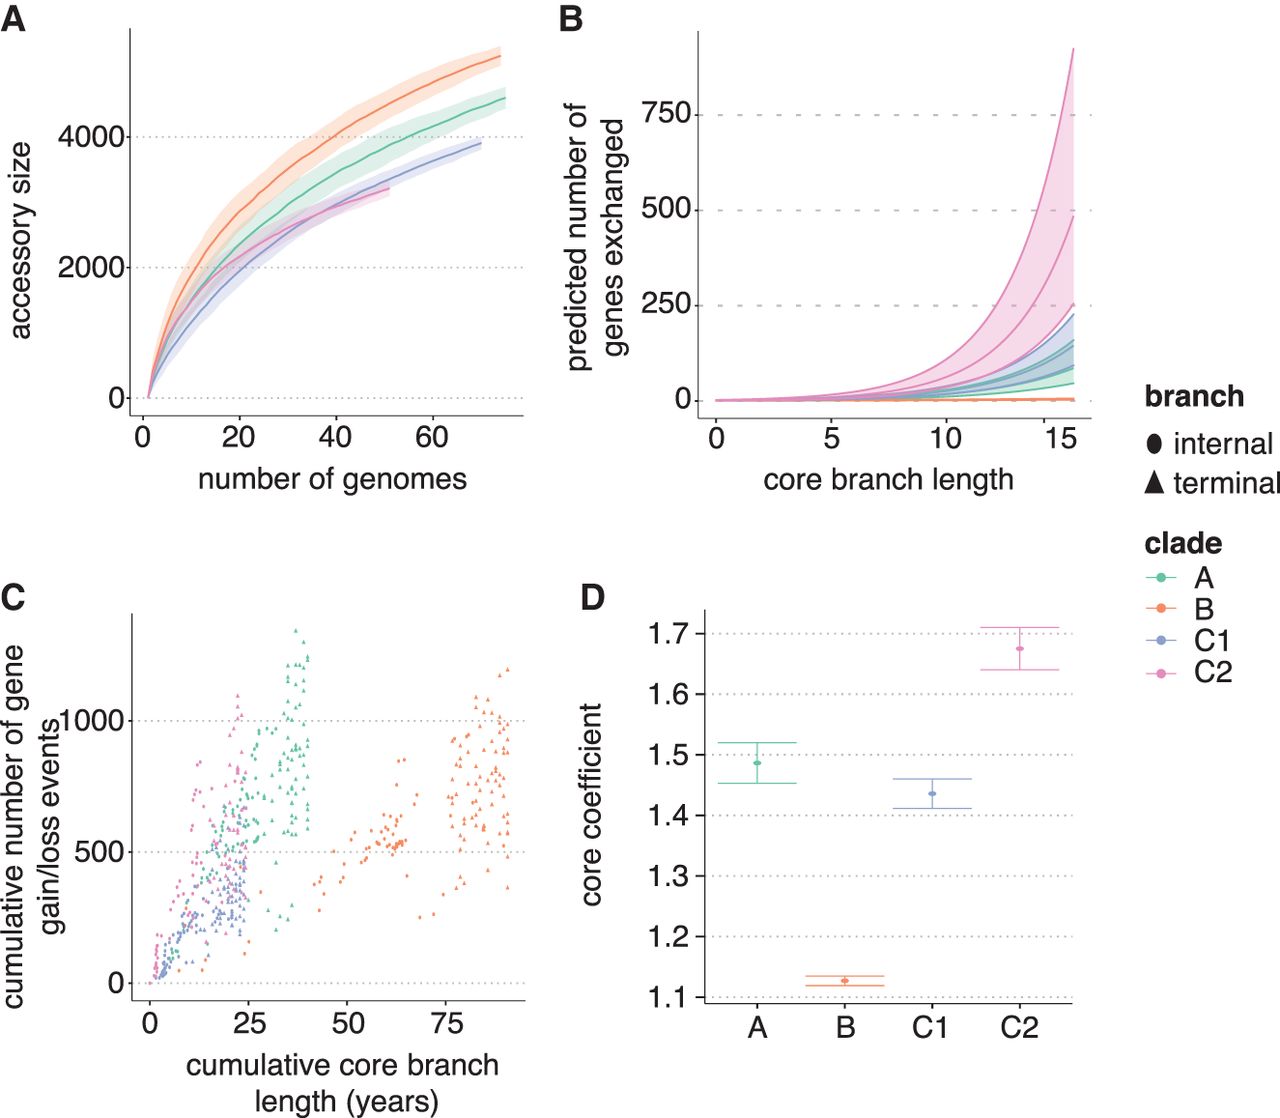
Comparison of the gene gain and loss rate in major clades of E. coli. (A) Pangenome accumulation curves for the clades in the E. coli-ST131 data sets. Pangenome data sets were taken from Gladstone et al. (2021) and were constructed using Panaroo. (B) The corresponding predicted slope of the relationship between core genome branch length and the number of gene gain and loss events as inferred by the Panstripe algorithm. (C) The cumulative number of gene gain and loss events versus the cumulative branch length starting from the root node of each tree in A. This is a similar plot to the common “root-to-tip” plot used in phylogenetic dating. (D) The estimated parameters of the generalized linear model used in Panstripe. Error bars represent the 95% confidence interval of the parameter estimates. Higher values of the core coefficient indicate an increased rate of gene gain and loss.


