
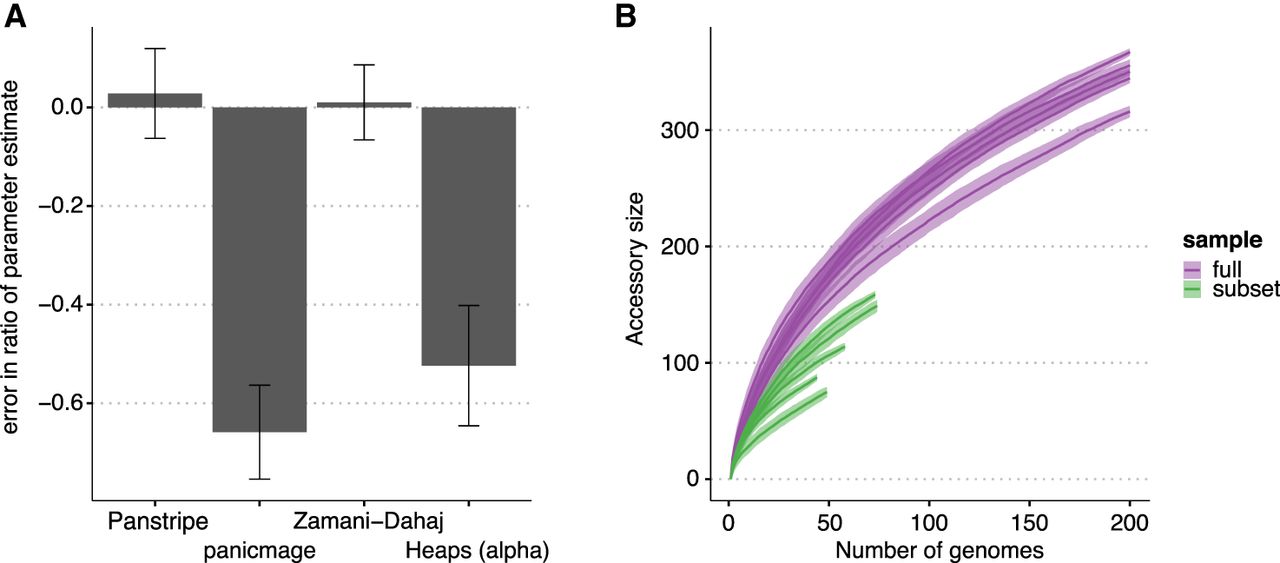
Figure 4.
Impact of simulated population structure on each algorithm. (A) Bars indicate the mean percentage error in the estimated ratio of gene gain and loss rate in a smaller subclade of the simulated data compared with estimating the rate on the full simulation. Only Panstripe and the method of Zamani-Dahaj et al. (2016) accurately reported similar parameters in both the small and large sets. This suggests that panicmage and fitting a Heaps' power law are highly sensitive to sampling biases in the data. (B) Similar to the Heaps' power law, pangenome accumulation curves provide misleading differences when comparing the subclade and full data sets.


