
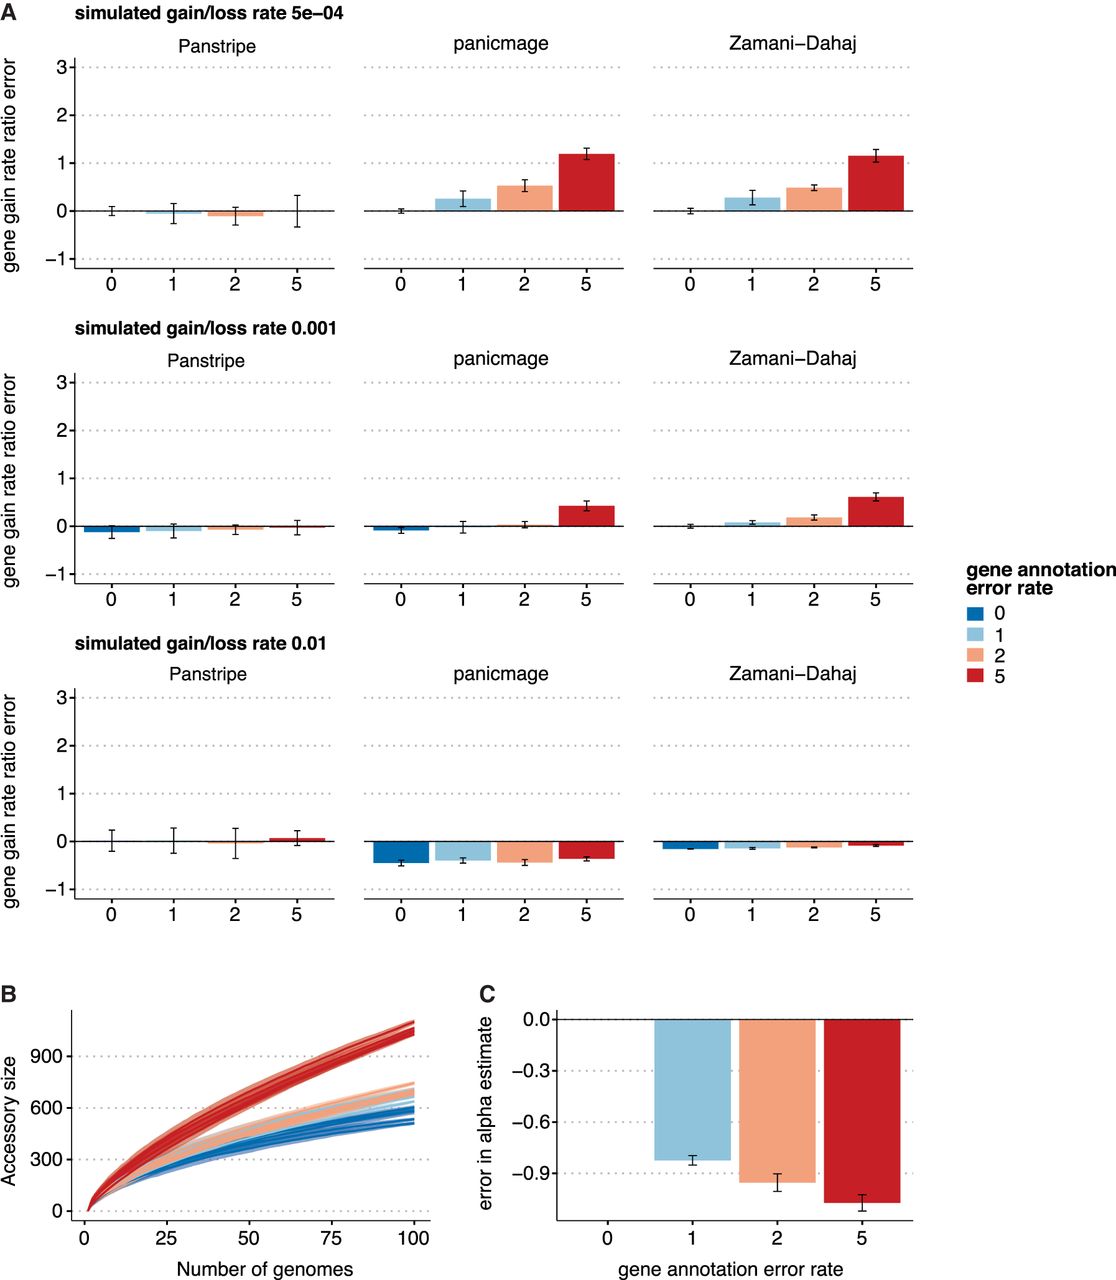
Results of each algorithm on simulated data with different error rates. (A) Bars indicate the mean percentage error in the estimated ratio of gene gain and loss rate compared to the reference rate of 5 × 10⁻⁴ with a simulated annotation error of zero. The three rows represent increasingly large gene gain and loss rates of 5 × 10⁻⁴, 0.001, and 0.01. The simulated annotation error rates are given along the x-axis. (B) Pangenome accumulation curves with a simulated gene gain and loss rate of 0.001. The colors represent the increasing annotation error rates. (C) The corresponding error in the α parameter estimates after fitting Heaps' law to the curves in B. Lower α estimates indicate a more “open” pangenome. Thus, higher rates of annotation error can lead to incorrect estimates of whether a pangenome is open or closed.


