
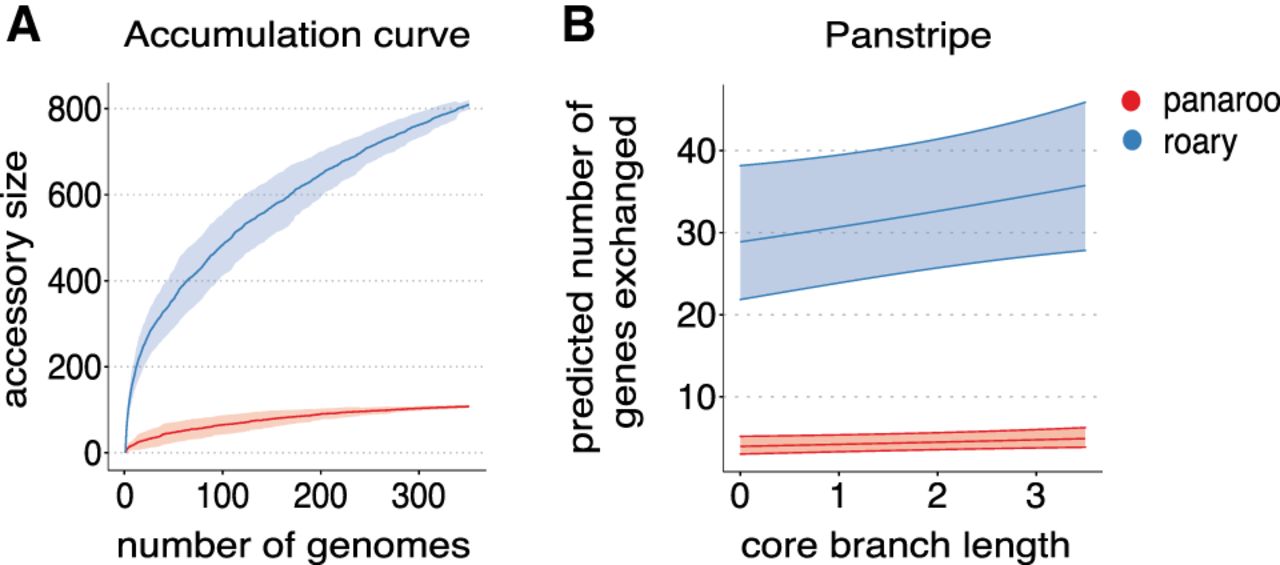
Comparison of methods on a highly clonal Mycobacterium tuberculosis (Mtb) outbreak data set. (A) Pangenome accumulation curves after running both Roary (blue) and Panaroo (red) on 351 Mtb genomes from an outbreak in London. The ribbon indicates the variation in the curve found by permuting the genome order 100 times. (B) Plot of the core branch length versus the predicted number of accessory genes for the same set of Mtb genomes according to the Panstripe model. The ribbon displays the 95% confidence interval of the Panstripe model fit and indicates that the inferred slopes are not significantly different from zero for both the Panaroo and Roary presence–absence matrices.


