
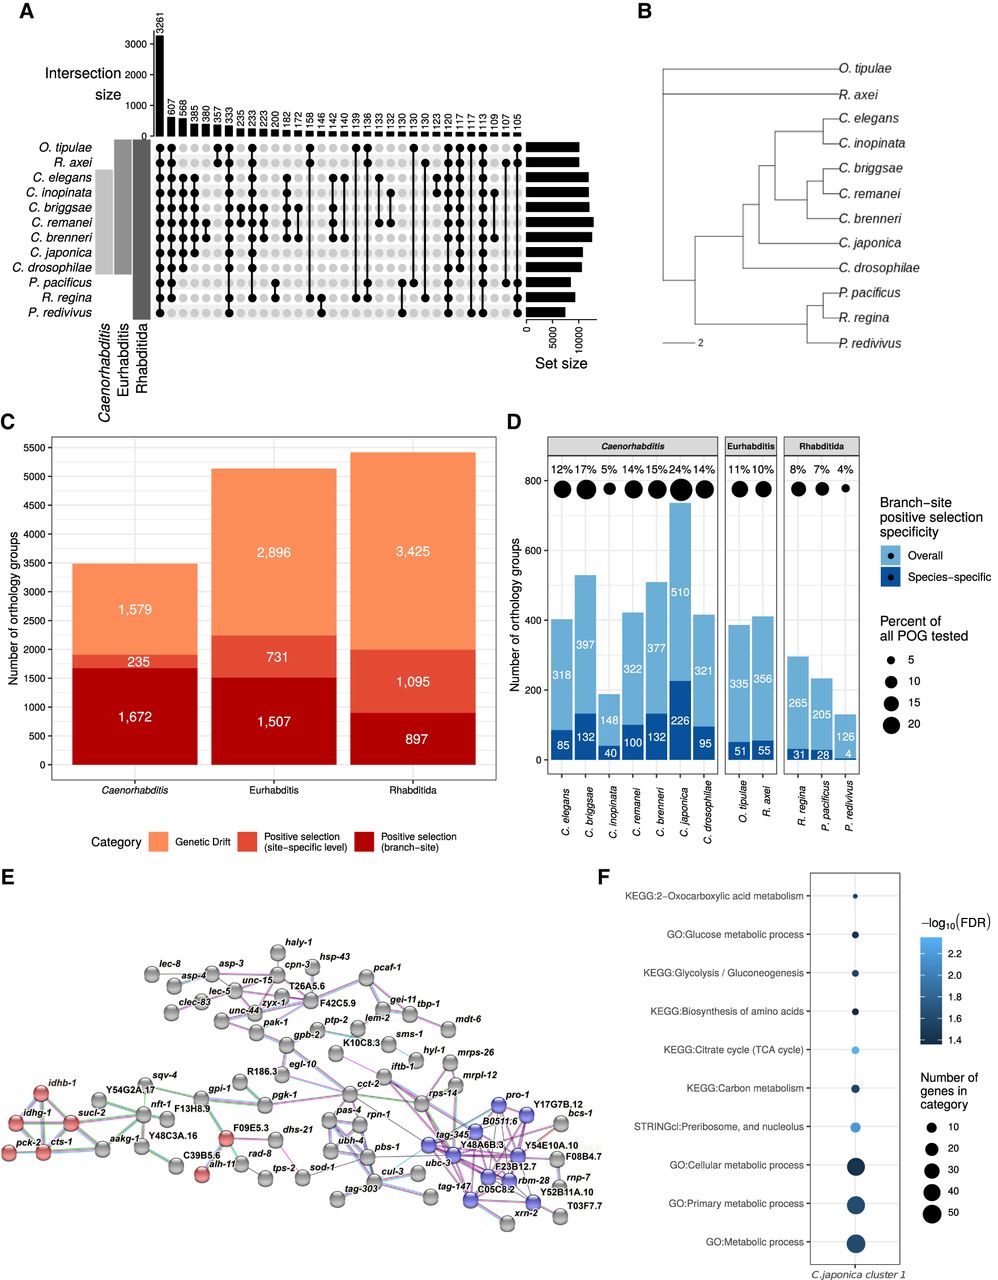
Orthology and phylogenetic relationships. (A) Upset plot depicting the number of orthology groups shared between different species. (B) Combined unrooted phylogenetic tree establishing the relationships between all studied species. The tree is based on individual gene trees of 1516 orthology groups that contain exactly one orthologous gene for each of the 12 studied species. The branch length is defined as the number of amino acid substitutions per site. (C) Distribution of genetic drift and positive selection in orthologous groups encompassing Caenorhabditis, Eurhabditis, or Rhabditida. Positive selection is reported separately for detection either in the site-specific (light red) or branch-site (dark red) analysis. (D) Distribution of orthology groups with significant signatures of branch-site-specific positive selection across species. ProteinOrtho groups (POGs) are colored for positive selection either in one (dark blue) or multiple (light blue) species. The percentage of species-specific positive selection instances (dark blue) among all POGs that contain orthologs from the respective species are shown on top of the bars. (E) STRINGdb network of C. japonica proteins with positive selection signals. Nodes represent single proteins, and edges represent protein–protein associations provided by STRINGdb. Edge colors represent protein–protein association types: blue, from curated databases; pink, experimentally determined; green, gene neighborhood; red, gene fusions; dark blue, gene co-occurrence; black, coexpression; and purple, protein homology. Proteins belonging to the glycolysis and TCA cycle network are marked in red; proteins of the ribosome biogenesis cluster are colored in blue. (F) KEGG, Gene Ontology, and STRINGdb cluster terms enriched in the protein cluster depicted in E.


