
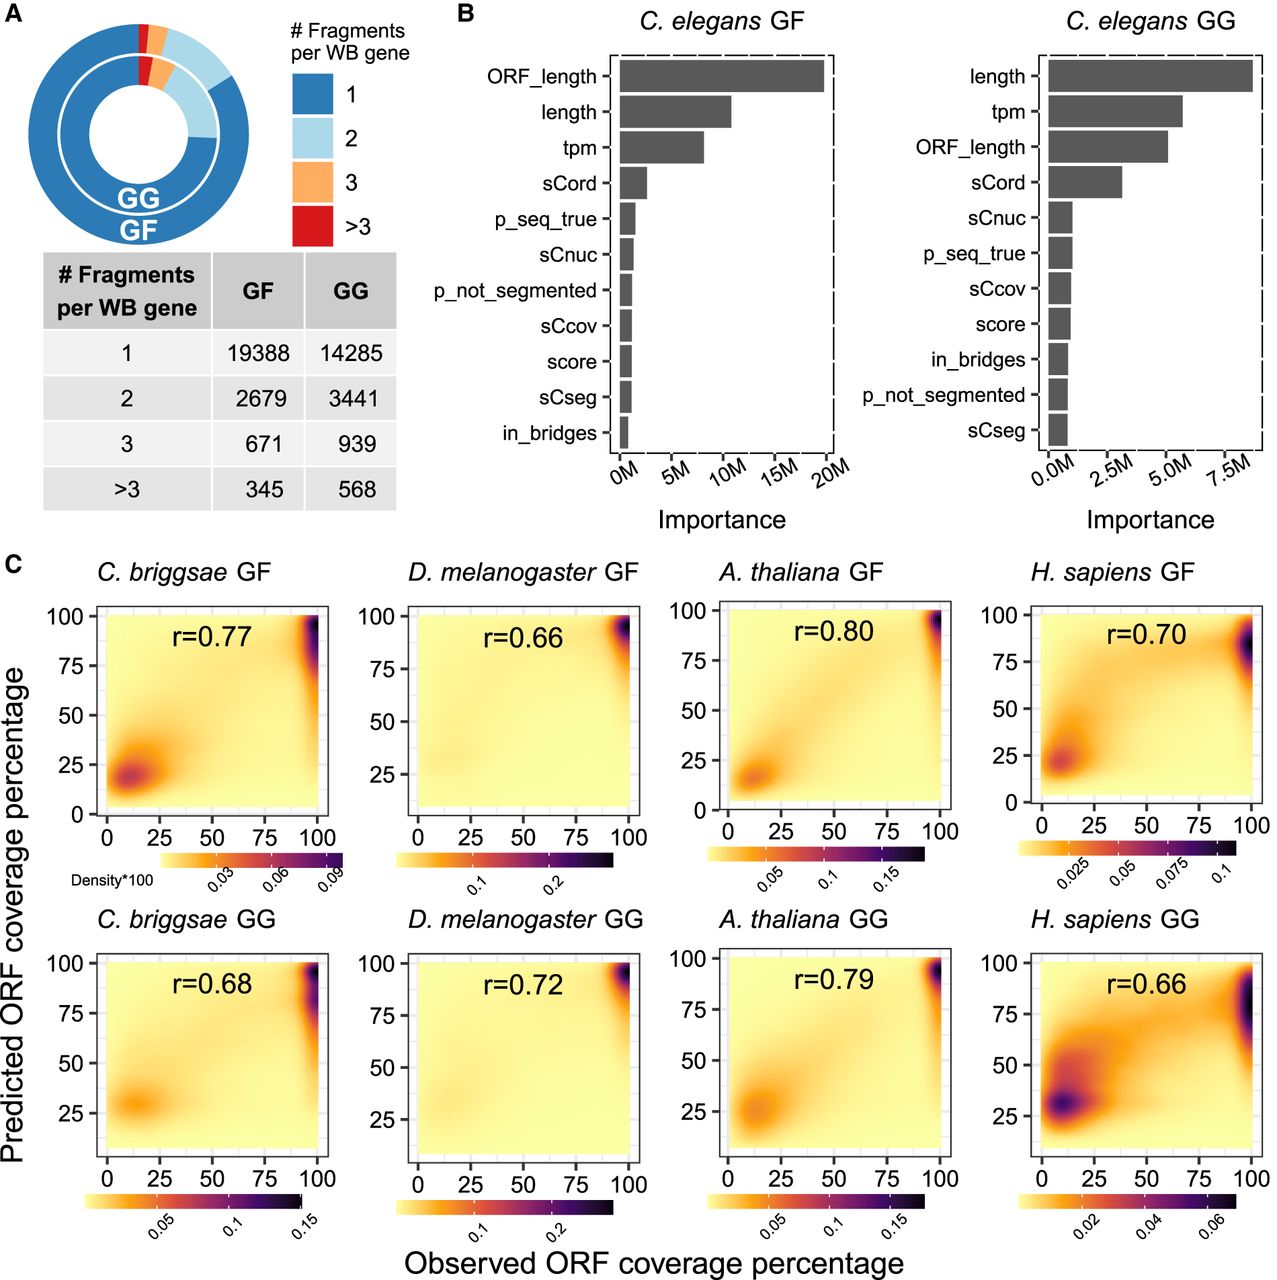
Figure 2.
Benchmarking machine-learning-assisted filtering of fragmented transcripts in assemblies. (A) Pie chart and table representing the fragmentation status of the C. elegans GF and the GG transcriptome assembly. Shown are the proportions of WormBase genes overlapping with Trinity assembled transcripts. (B) Bar chart depicts contributions of individual features to the random forest models of GF and GG. A detailed description of features and their sources is provided in Supplemental Table S4. (C) 2D kernel density plots of the observed versus predicted completeness using the GF and GG model established in C. elegans in four other model organisms.


