
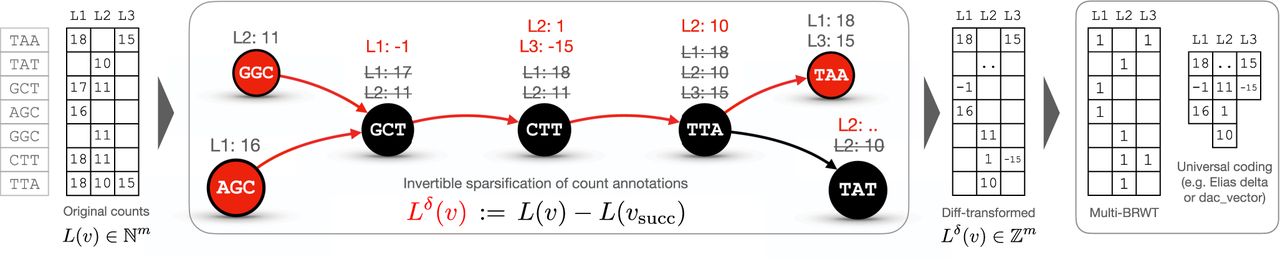
A schematic diagram illustrating the encoding of k-mer counts in m columns with the proposed approach. Circles represent nodes of a de Bruijn graph. Edges are shown as arrows. Red nodes represent anchor nodes, and red edges represent paths to row-diff successors. The transformed counts are shown in red (e.g., cf. L1: − 1 for k-mer GCT after the transform and L1:17, L2:11 before; for k-mer TAT, the transformed counts are not shown because they depend on TAT's successors, not shown in the graph). Then, the diff-transformed matrix is decomposed into an indicator binary matrix stored in the compressed multi-BRWT representation, supporting the rank operation on the columns and arrays storing nonzero diffs.


