
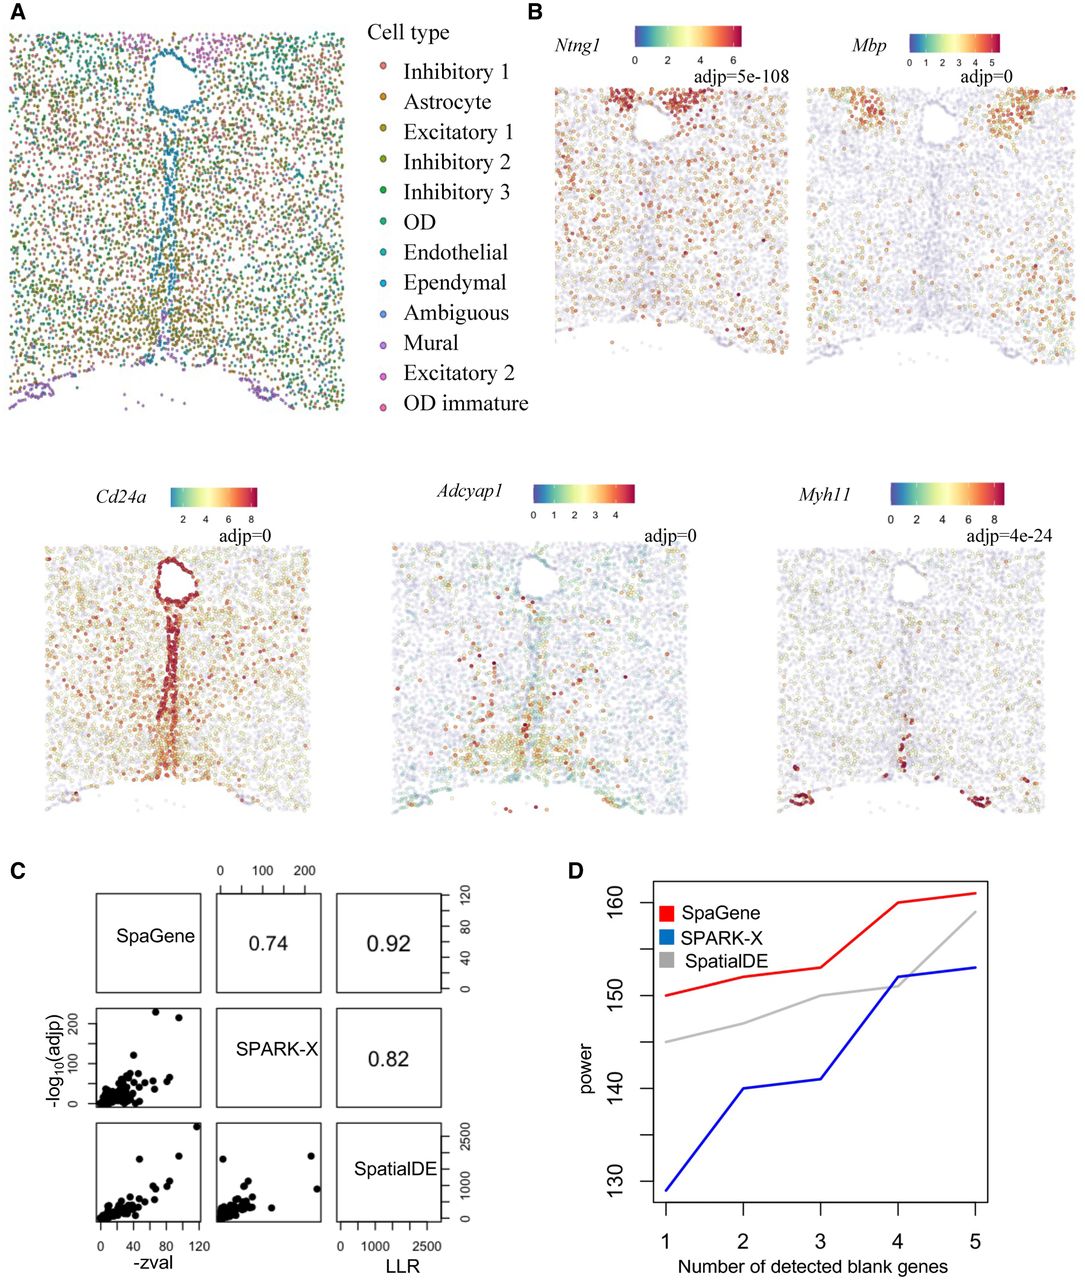
Figure 3.
Application of SpaGene to MERFISH of mouse preoptic hypothalamus data. (A) Cell clustering based on transcriptional profiles alone. (B) Visualization of five spatial variable genes (high expression in red and low in blue) with adjusted P-values from SpaGene. (C) Pairwise correlation of results from SpaGene, SpatialDE, and SPARK-X. (D) Power plot shows the number of genes with spatial expression pattern (y-axis) identified by SpaGene, SpatialDE, and SPARK-X versus the number of blank control genes identified at the same threshold.


