
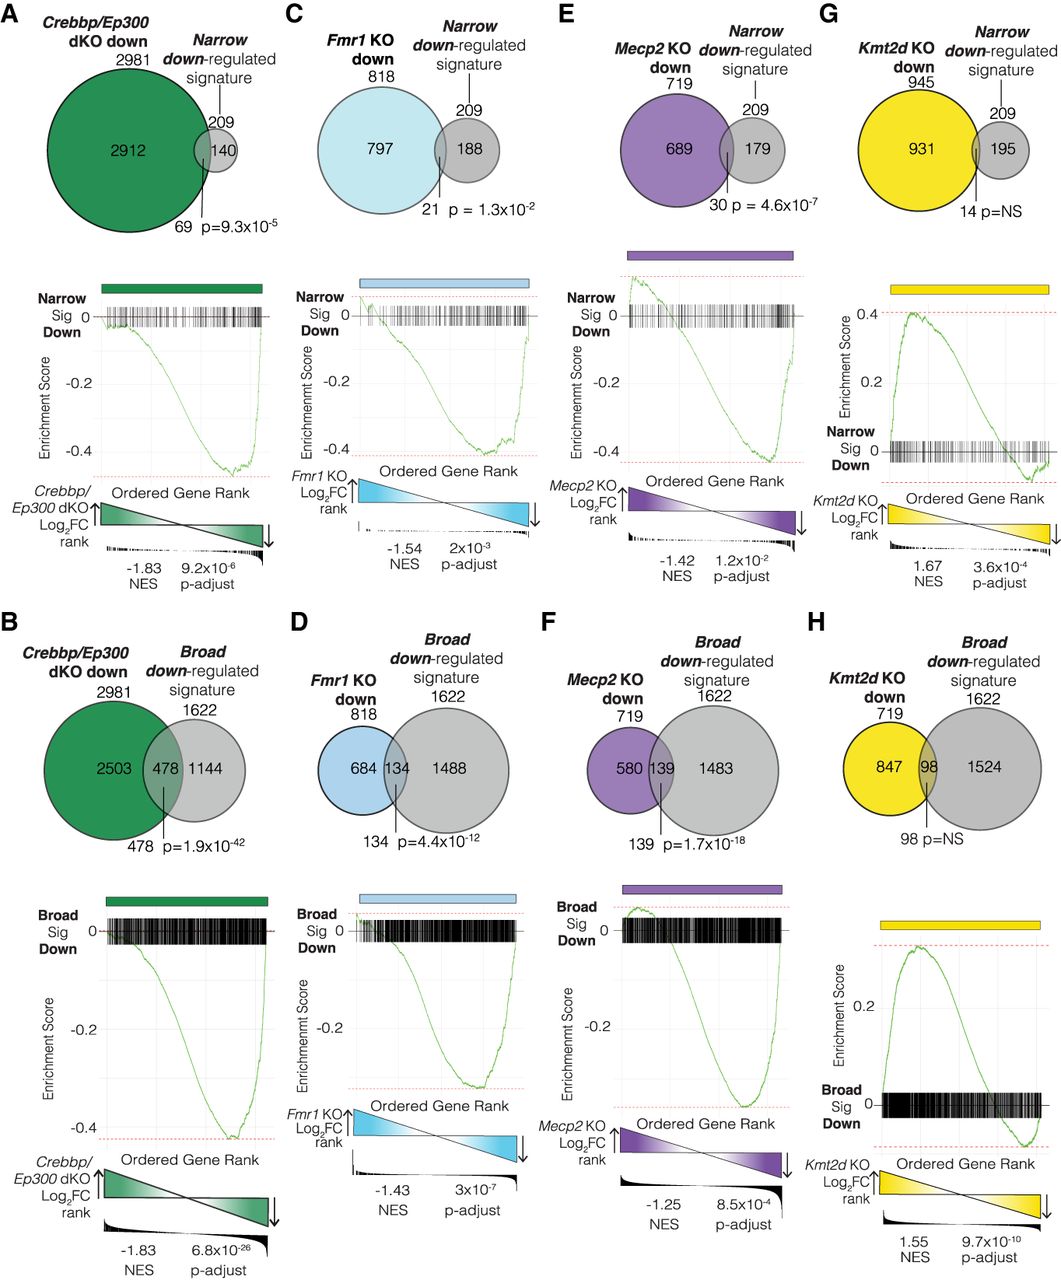
Identification of transcriptional signature in mouse models of ASD. (A,B) Overlap (top) and GSEA (bottom) analysis of the narrow (A) and broad (B) down-regulated transcriptional signature compared with differentially expressed genes in a Crebbp/Ep300 (also known as Kat3a/b) double knockout (KO) mouse model. (C,D) Overlap and GSEA analysis of the narrow (C) and broad (D) down-regulated transcriptional signature compared with differentially expressed genes in an Fmr1 KO mouse model of FXS. (E,F) Overlap and GSEA analysis of the narrow (E) and broad (F) down-regulated transcriptional signature compared with differentially expressed genes in a Mecp2 KO mouse model of Rett syndrome. (G,H) Overlap and GSEA analysis of the narrow (G) and broad (H) down-regulated transcriptional signature compared with differentially expressed genes in a Kmt2d KO mouse model of Kabuki syndrome. Overlap significance based on hypergeometric tests. NES indicates normalized enrichment score.


