
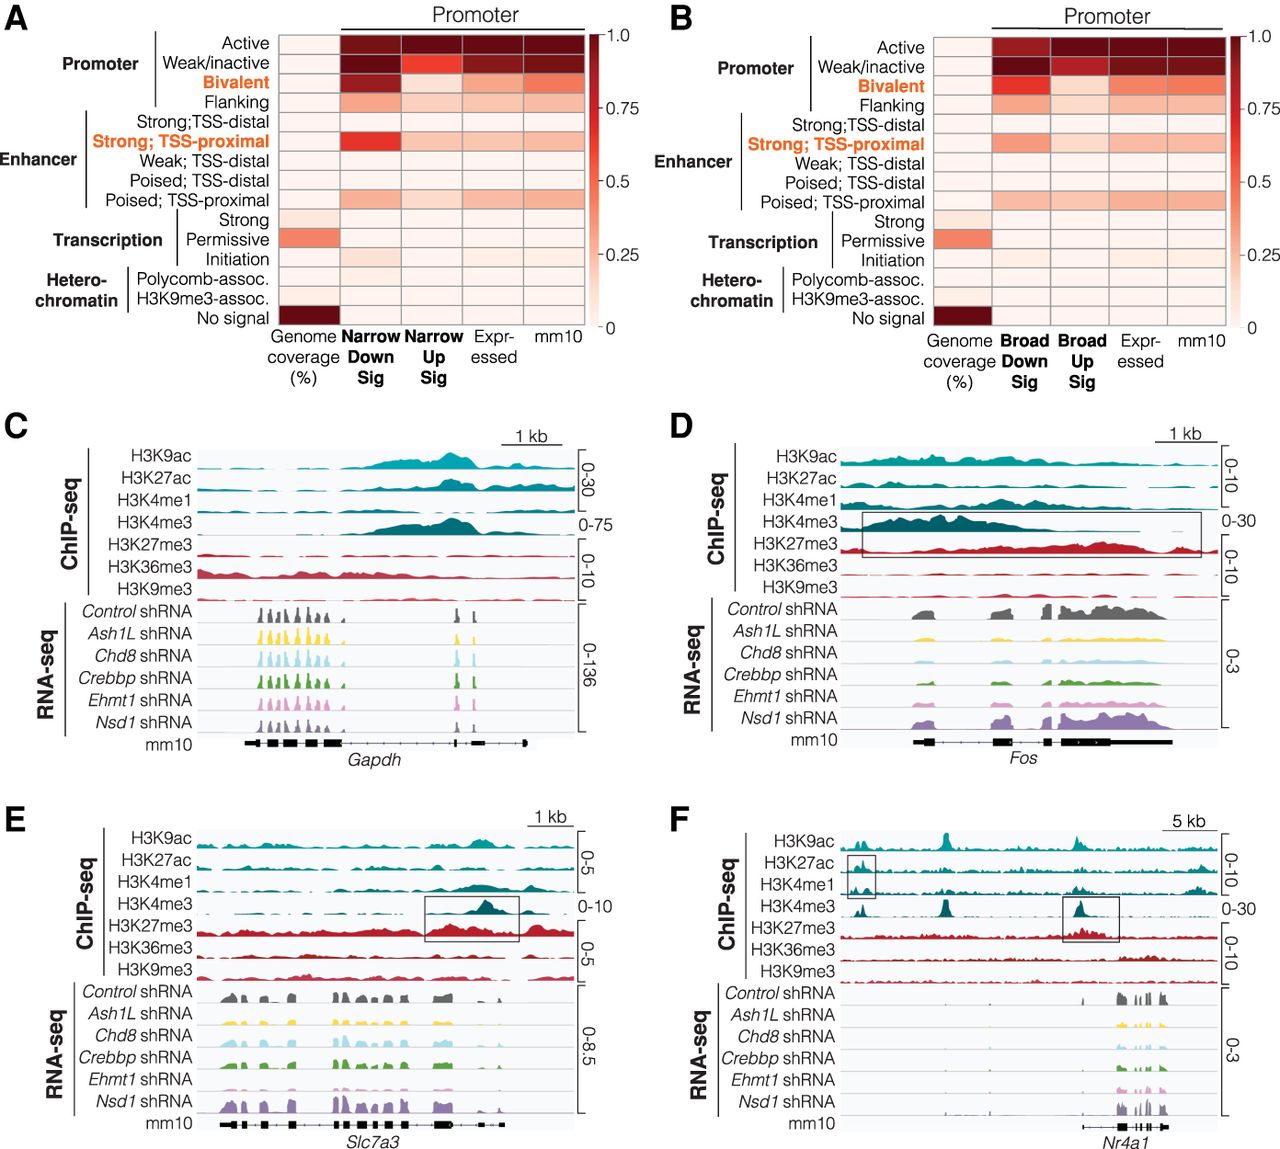
Chromatin states in transcriptional signature genes. (A) ChromHMM analysis of promoter (500 bp upstream of transcription start site [TSS]) of narrow transcriptional signature genes. (B) ChromHMM analysis of promoter (500 bp upstream of TSS) of broad transcriptional signature genes. (C) Gene track of a control gene, Gapdh, that is not regulated by ASD-linked chromatin modifiers. (D–F) Gene tracks of down-regulated transcriptional signature genes Fos (D), Slc7a3 (E), and Nr4a1 (F) that have bivalent domains (high H3K4me3 and high H3K27me3), low H3K36me3, and strong proximal enhancer sites (H3K4me1 and H3K27ac peaks upstream of Nr4a1) typical of down-regulated transcriptional signature genes. Boxes highlight these chromatin states. Expressed indicates genes expressed in neuronal culture system. Fold enrichments were calculated as the ratio of the fraction of bases in a given chromatin state that were present in our input gene coordinates of interest to the fraction of the genome described by the input gene coordinates. Displayed heatmaps represent overlap enrichment output values range-normalized by column.


