
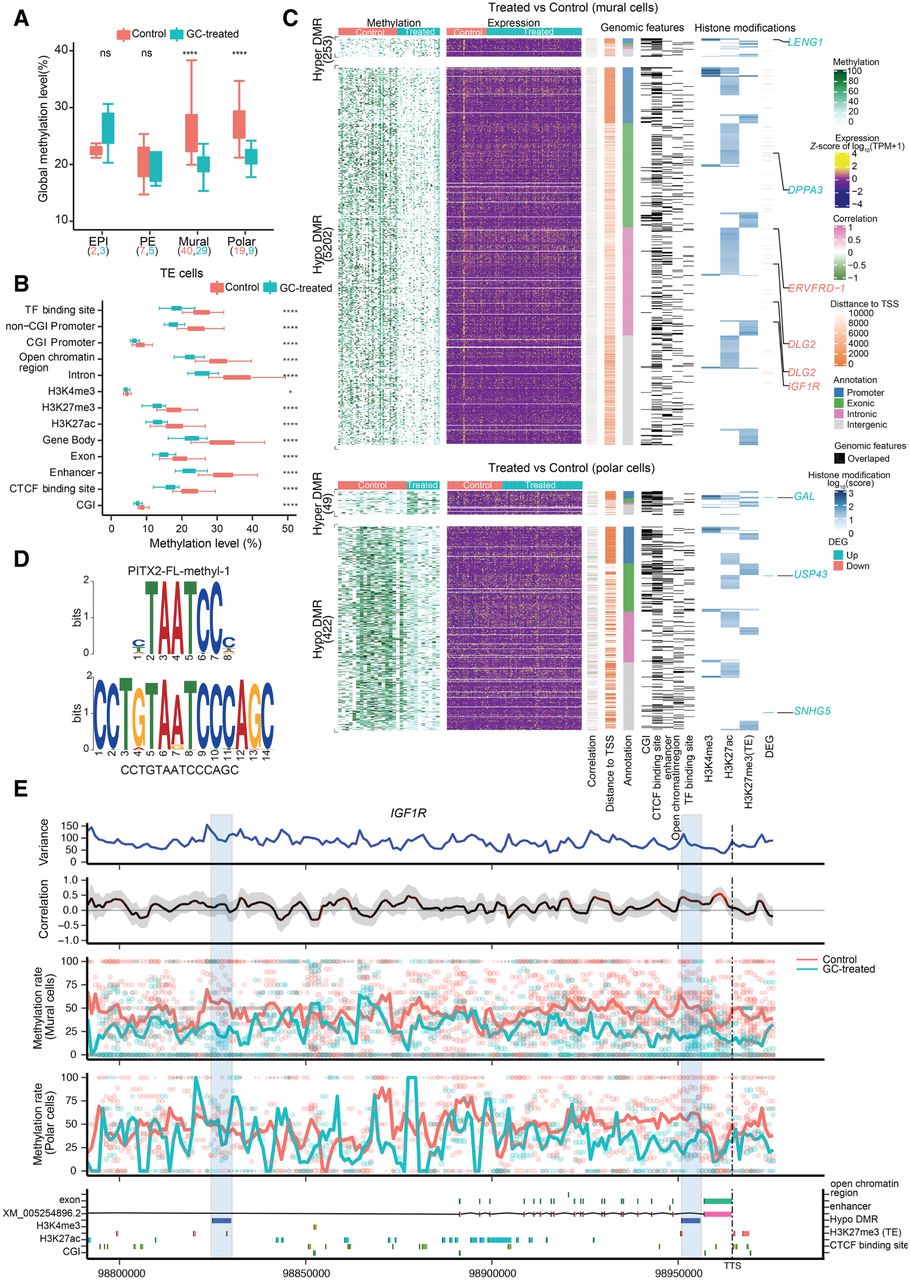
DMRs and genome-wide associations between methylation and transcriptional heterogeneity in control and glucocorticoid-exposed embryos. (A) Boxplot of the global DNA methylation levels showing the heterogeneity for each lineage in control and glucocorticoid-exposed embryos. The number of cells is labeled at the bottom. (B) Boxplot of methylation levels for different genomic contexts. (C) Comprehensive visualization of associations between methylation, expression, genomic features, and histone modification. From left to right, heatmap represents the methylation level of DMRs in individual cells with the number of DMRs indicated on the left. Missing values in DNA methylation heatmap are indicated with white: the expression level of nearest genes (from transcription start sites [TSSs], including different isoforms) for each DMR, the estimated weighted correlation between the DMRs’ methylation level and gene expression, the distance to its nearest TSS, the DMR annotation, the corresponding overlapping genomic features, the histone modification scores for the DMRs. Genes highlighted are the selective DEGs associated with the DMRs, where red represents down-regulated expression and blue represents up-regulated gene expression. (D) Top enriched sequence aligned to the most significant binding motif identified, PITX2 (217 hits, P = 1.2 × 10⁻⁷ and P of alignment = 0.0001). (E) Representative methylation variance, correlation, and methylation rate near the 3′ region of IGF1R. Shown from bottom to top are the annotation of the IGF1R locus with genomic features, histone modifications; the estimated methylation level of 3-kb sliding windows for each cell with dot size indicating CpG coverage, and dot colors indicating different treatments. The solid curve denotes the weighted mean methylation rate, with line colors representing different treatments and dashed vertical lines delineating the position of transcription termination sites (TTSs) of IGF1R. The correlation between the methylation rate and IGF1R expression for each window. Color of the curve represents the level of significance for the correlations, and the gray-shaded area denotes the 95% confidence interval of the correlation coefficient using the estimated weighted DNA-methylation variance between cells. Two hypomethylated DMRs identified between the control and treated mural cells are highlighted with blue rectangles.


