
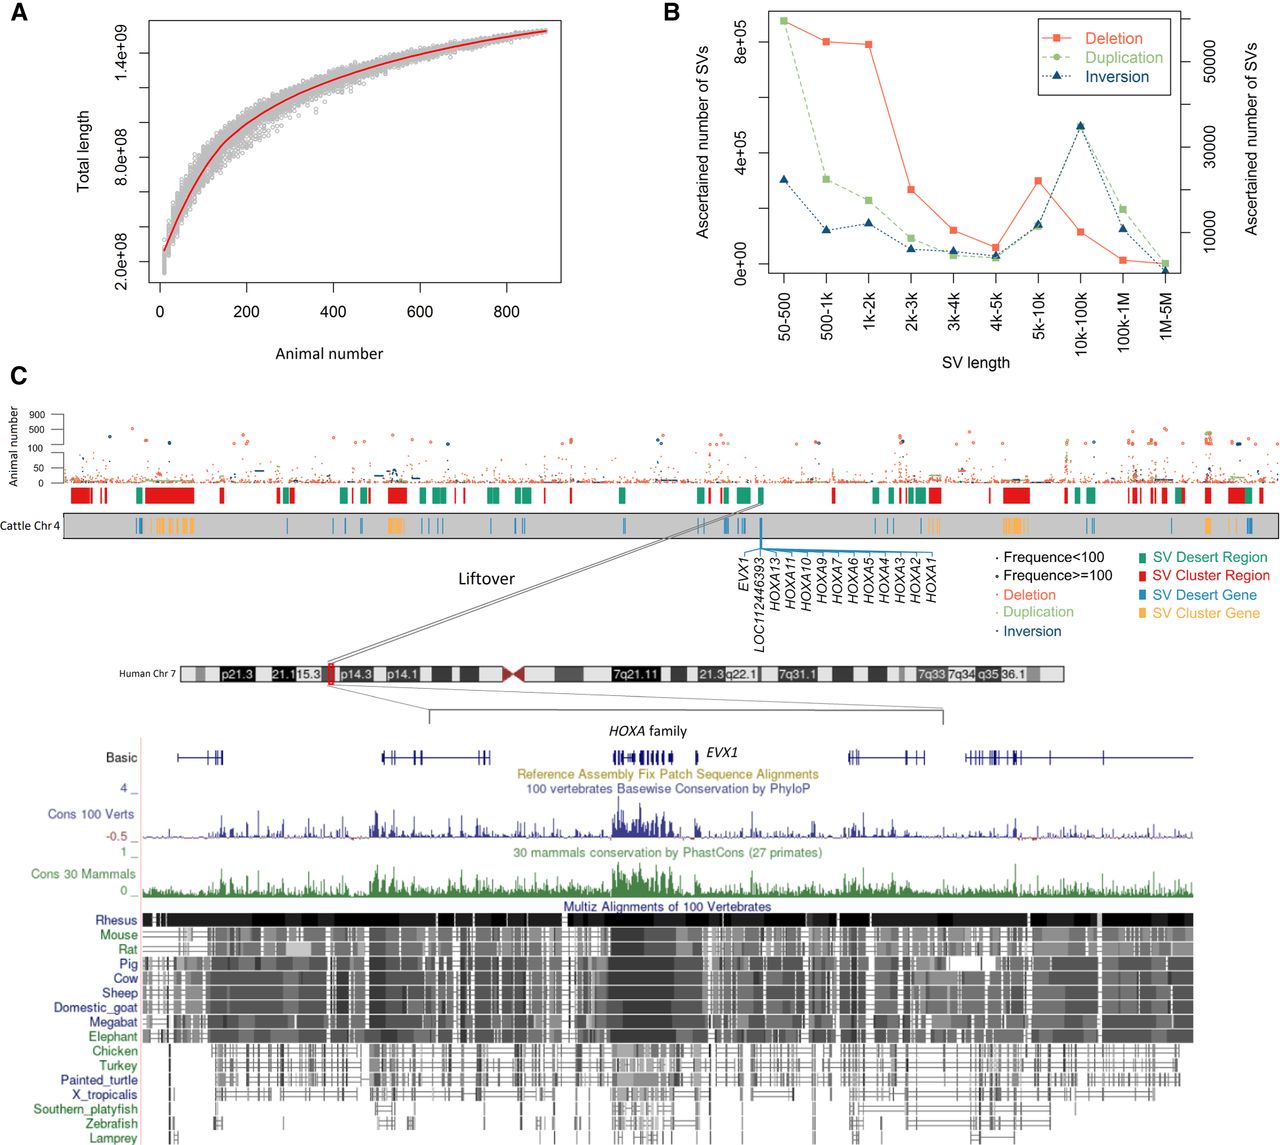
Statistics and chromosomal distribution of structural variations (SVs) in 898 cattle. (A) Simulations of the increase in SV number detected with the increase of animal number. No more substantial SV increase when the animal number is over 800, indicating that selected cattle were sufficient to capture the majority of bovine SV. The red line is the fit curve of data points in light green. (B) SV density of different sizes for each SV type; the left y-axis is for the deletion, and the right y-axis is for duplication and inversion. (C) SV distribution on cattle Chromosome 4 near the HOXA locus. (SV Desert Gene) Genes located in the SV desert region; (SV Cluster Gene) genes located in the SV cluster region.


