
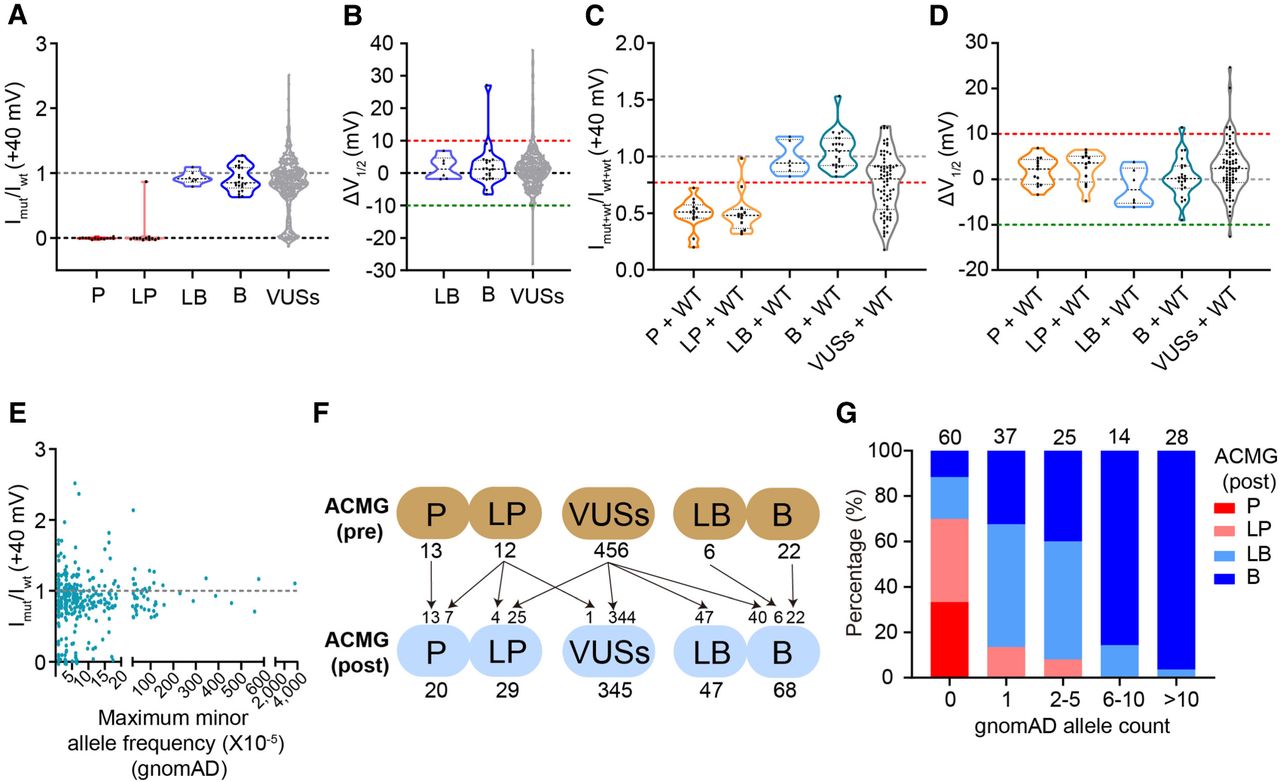
Pathogenicity interpretation of KCNQ4 clinical missense variants with functional data. (A) Violin plots comparing normalized peak currents at +40 mV when expressed alone for KCNQ4 missense variants observed in the clinic, colored by curated classification based on ACMG criteria without our functional data (13 pathogenic, 12 likely pathogenic, six likely benign, 22 benign, and 456 VUSs). (B) Distribution of the shifts in V1/2 (ΔV1/2) for six likely benign, 22 benign, and 394 VUSs with measurable V1/2. (C,D) Violin plots comparing normalized peak currents (C) and ΔV1/2 (D) for coexpressing variants interpreted as pathogenic, likely pathogenic, likely benign, benign, and VUSs with WT. The functional properties of VUSs in the heterozygous state only contained 75 variants showing reduced-current variants in the homozygous state. The red dashed line in C indicates 0.77 of the WT value. (E) Relationship between maximum minor allele frequency in any population and normalized peak currents recorded at +40 mV for 335 variants found in gnomAD database (p.H455Q with high allele frequency was not included). (F) Variants were classified based on ACMG/AMP criteria and reclassification with our functional data as BS3 and PS3 evidence. (Top) Variants were classified without our functional data. (Bottom) Variants were reclassified with our functional data. (G) Pathogenicity interpretation varied with the different gnomAD allele counts.


