
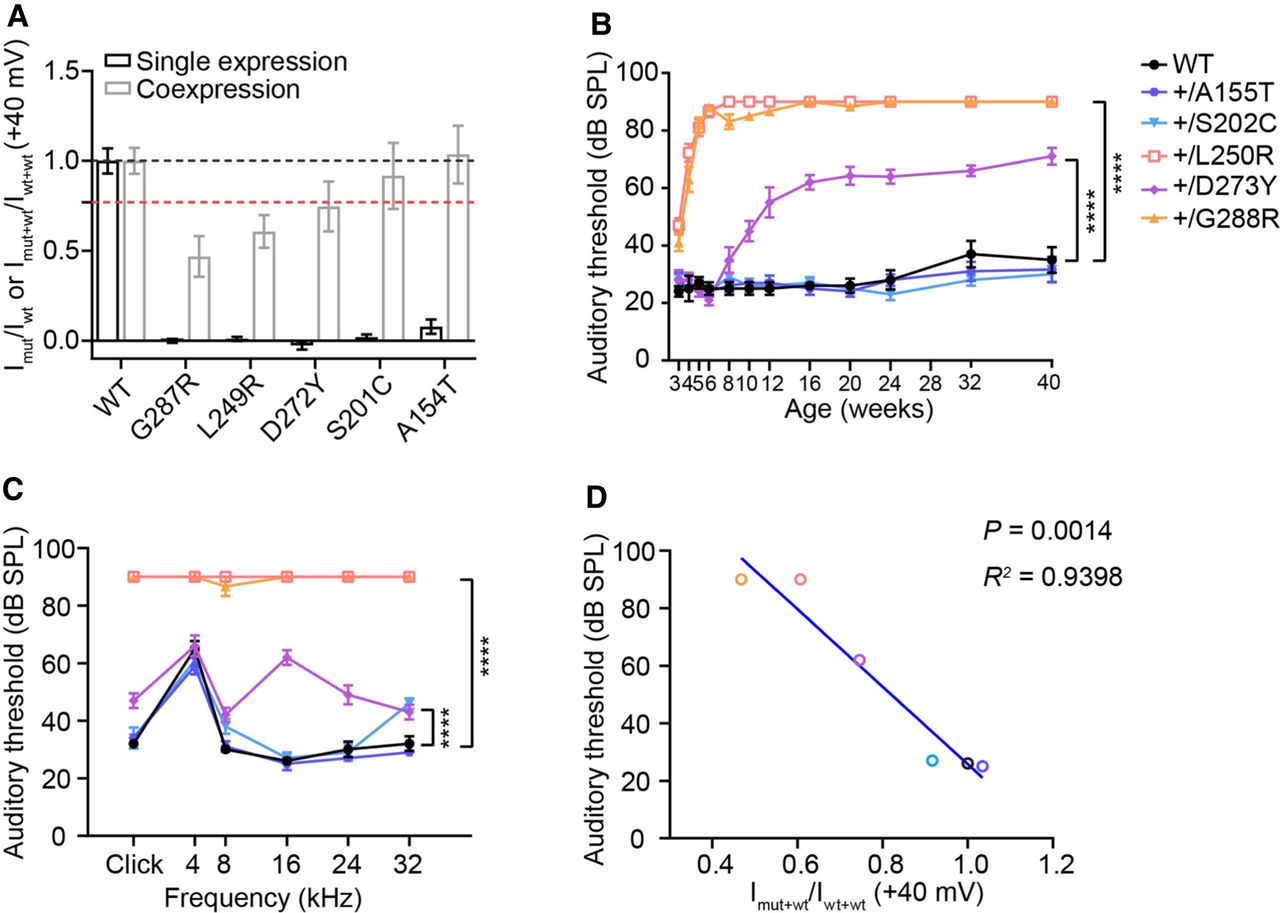
Correlation between in vitro functional data and auditory phenotypes in Kcnq4 mutant mice. (A) Comparison of the normalized currents of expressing WT, p.G287R, p.L249R, p.D272Y, p.S201C, p.A154T alone, and coexpressing with WT (n ≥ 3, mean ± SEM). The black dotted line indicates the WT value, and the red indicates 0.77 of the WT value. (B) ABR measurement of WT and five heterozygous mutant mouse strains at 16 kHz at different ages. At least three mice were measured in each strain and each age. Data were analyzed by two-way ANOVA with a Dunnett correction. (****) P < 0.0001, compared with WT. (C) ABR measurement of WT and five heterozygous mutant mouse strains at the age of 16 wk at different frequencies. (D) Correlation between in vitro functional data and hearing phenotypes in WT and five Kcnq4 mutant heterozygous mouse strains result in R2 = 0.9398 and P = 0.0014 by Pearson's correlation.


