
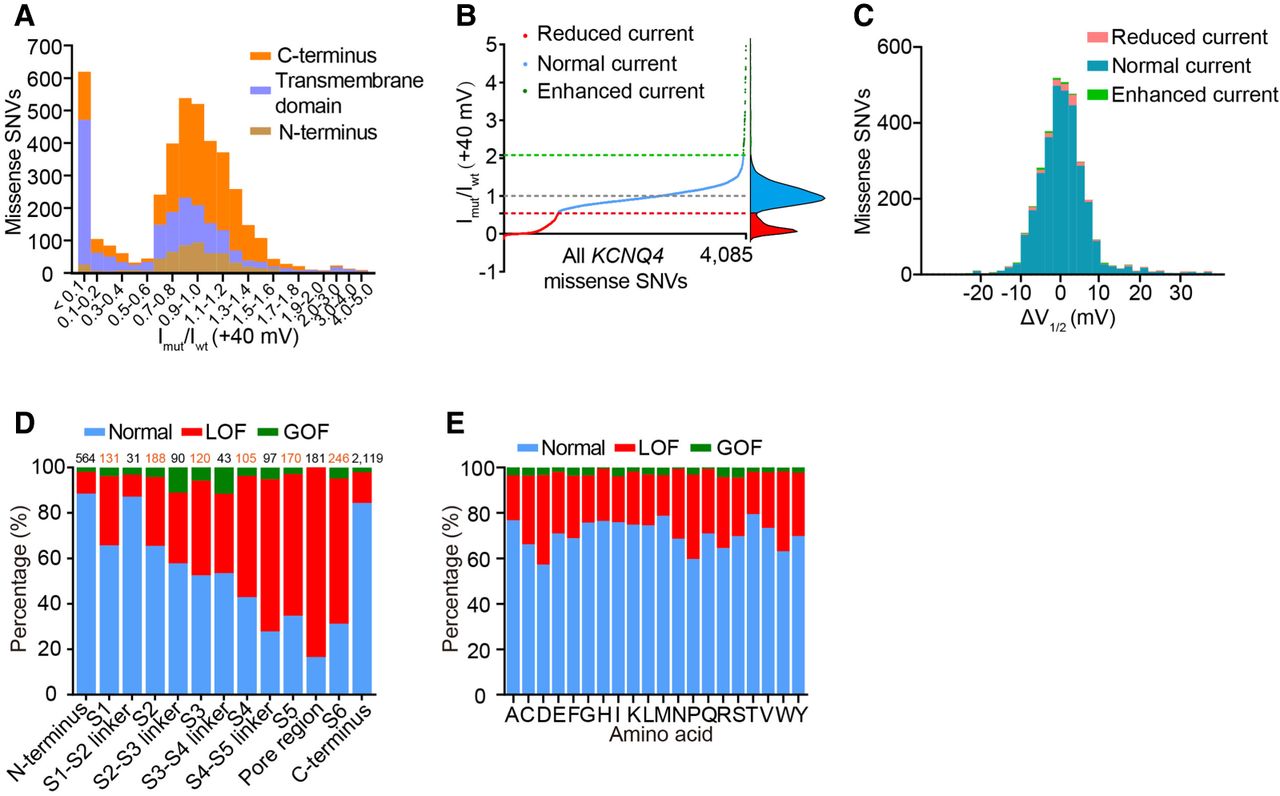
Functional classification of 4085 KCNQ4 missense SNVs when expressed alone. (A) The distribution of the normalized currents measured at +40 mV of 4085 variants in the homozygous state. (B) Raw normalized currents ranked for all 4085 KCNQ4 missense SNVs. The red dashed line indicates 0.54 of the WT value; gray indicates the WT value; and green indicates 2.08 of the WT value. Functional classification was based on k-means clustering. The curve of kernel density estimation is shown on the right. (C) The distribution of ΔV1/2 generated from 3319 variants with available V1/2. (D) The percentage of each functional phenotype in each domain. The number above each column represents the number of missense SNVs contained in the corresponding domain. (LOF) Loss of function, (GOF) gain of function. (E) The percentage of each functional phenotype of each type of amino acid after mutation.


