
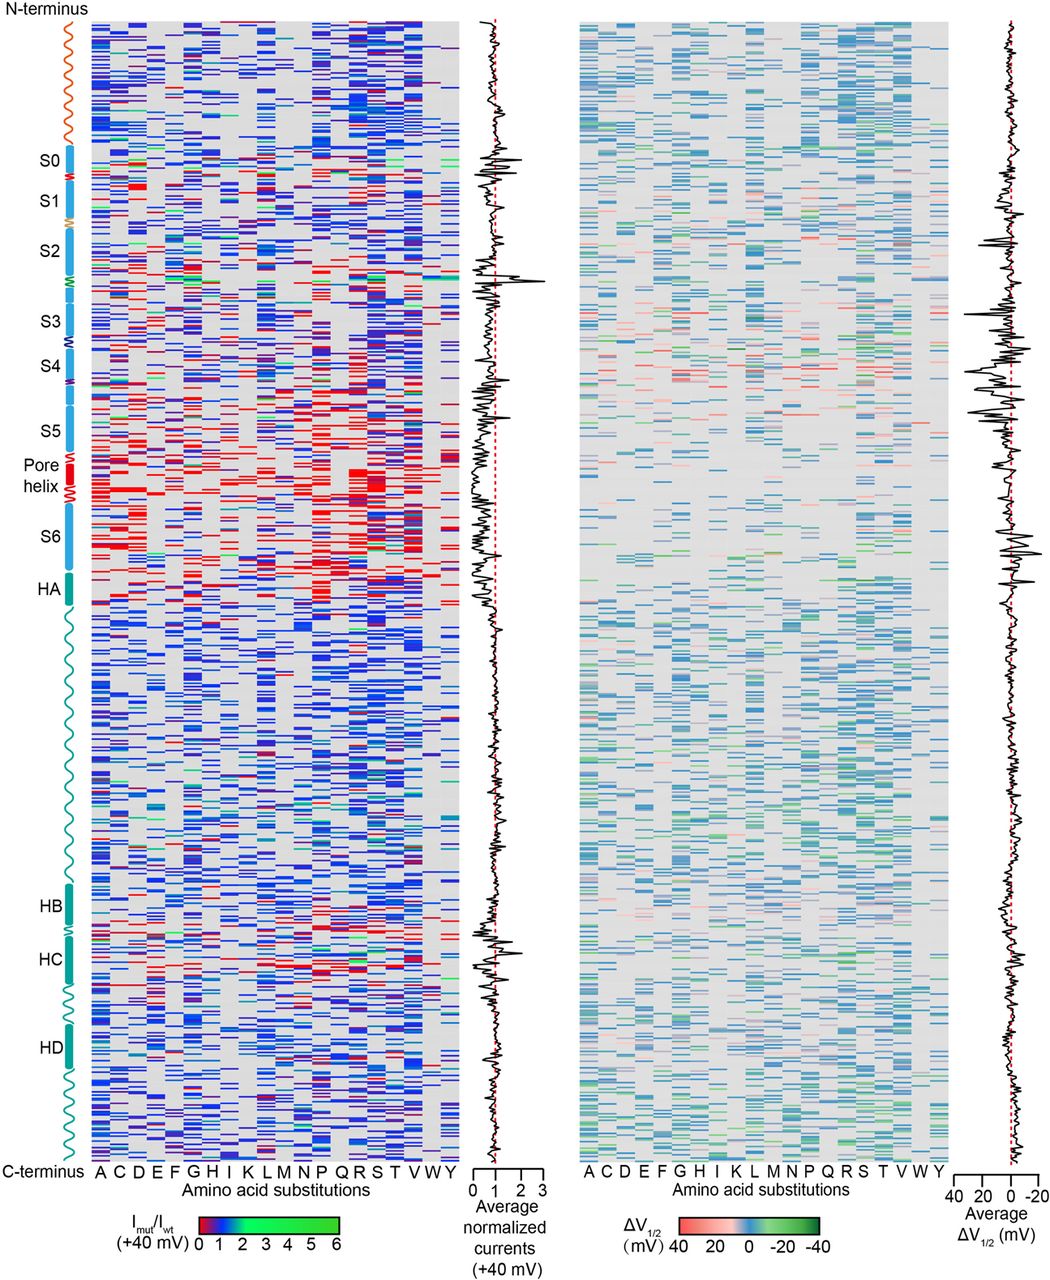
Sequence–currents and sequence–V1/2 maps for KCNQ4 missense SNVs. (Left) The average peak current values (normalized to WT) recorded at +40 mV of the 4085 missense SNVs when transfected alone were plotted in a heat map based on amino acid position along the KCNQ4 protein sequence (averaged from n ≥ 3 cells). The bar at the bottom shows the different current values with specific colors. Red and green indicate that an amino acid change results in low or high currents, whereas blue indicates currents similar to or close to the WT. The gray background indicates no data. Average normalized currents recorded at +40 mV summed by amino acid position are plotted to the right, showing the level of tolerance for any amino acid substitution. (Right) The shifts of the voltage-dependence of activation: V1/2 of the 3319 variants with currents enough to determine the V1/2. For 766 variants with severely reduced currents (<0.25 of the WT value in peak currents), V1/2 cannot be determined. ΔV1/2 indicates the change of V1/2 after mutation. ΔV1/2 = V1/2 in variants − V1/2 in WT. The V1/2 of WT is −17.10 ± 1.15 mV. Red indicates that sites show large shifts in activation V1/2 in the depolarizing direction, and green indicates that sites show large shifts in the hyperpolarizing direction.


