
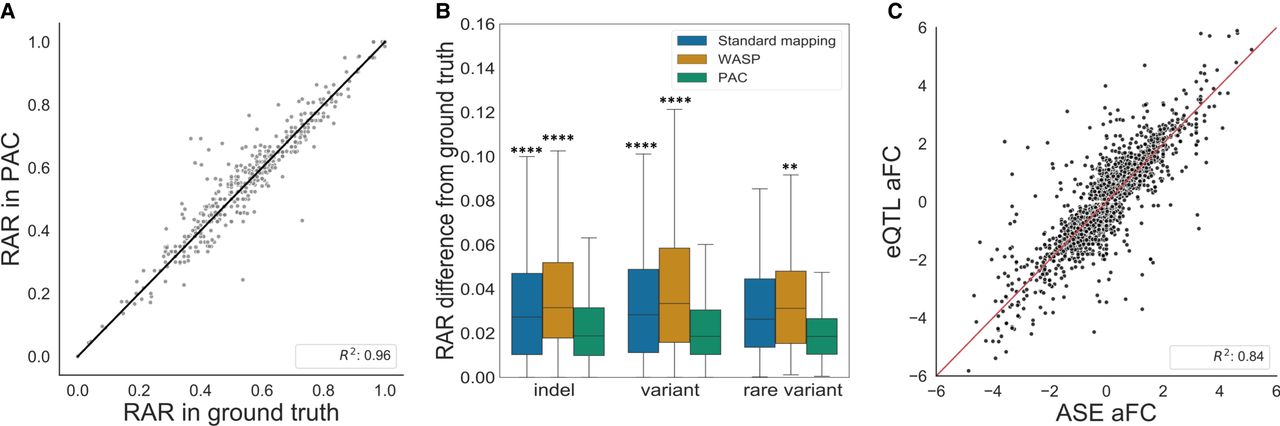
Performance of PAC compared to other methods. (A) Genome-wide correlation of reference allele ratios at heterozygous sites that PAC and standard alignment detect but that are discarded by WASP-filtering (Pearson's correlation R2 = 0.956, P = 2.6 × 10−266). Sites with at least 20× coverage were considered. (B) The difference in reference allele ratio of sites that are within 500 bp of an at least 6-bp indel, within 25 bp of another variant or a rare (MAF < 1%) variant in different analyses against the ground truth. Sites shared between all methods and with at least 20× coverage were considered. A Mann–Whitney U test was performed with Bonferroni correction to adjust for multiple testing. (****) P ≤ 1 × 10⁻⁴, (**) 1.00 × 10⁻³ < P ≤1.00 × 10⁻² , and stars above each box plot refer to the comparison against PAC. (C) Correlation of allelic fold change (aFC) values derived from ASE and eQTL analyses from 670 GTEx whole-blood samples. Genes with a significant eQTL (Q-value < 5%) and gene-level ASE information for at least 10 individuals were selected. Pearson correlation coefficients are shown for eQTL versus ASE aFCs derived using PAC (see also Supplemental Fig. 3).


