
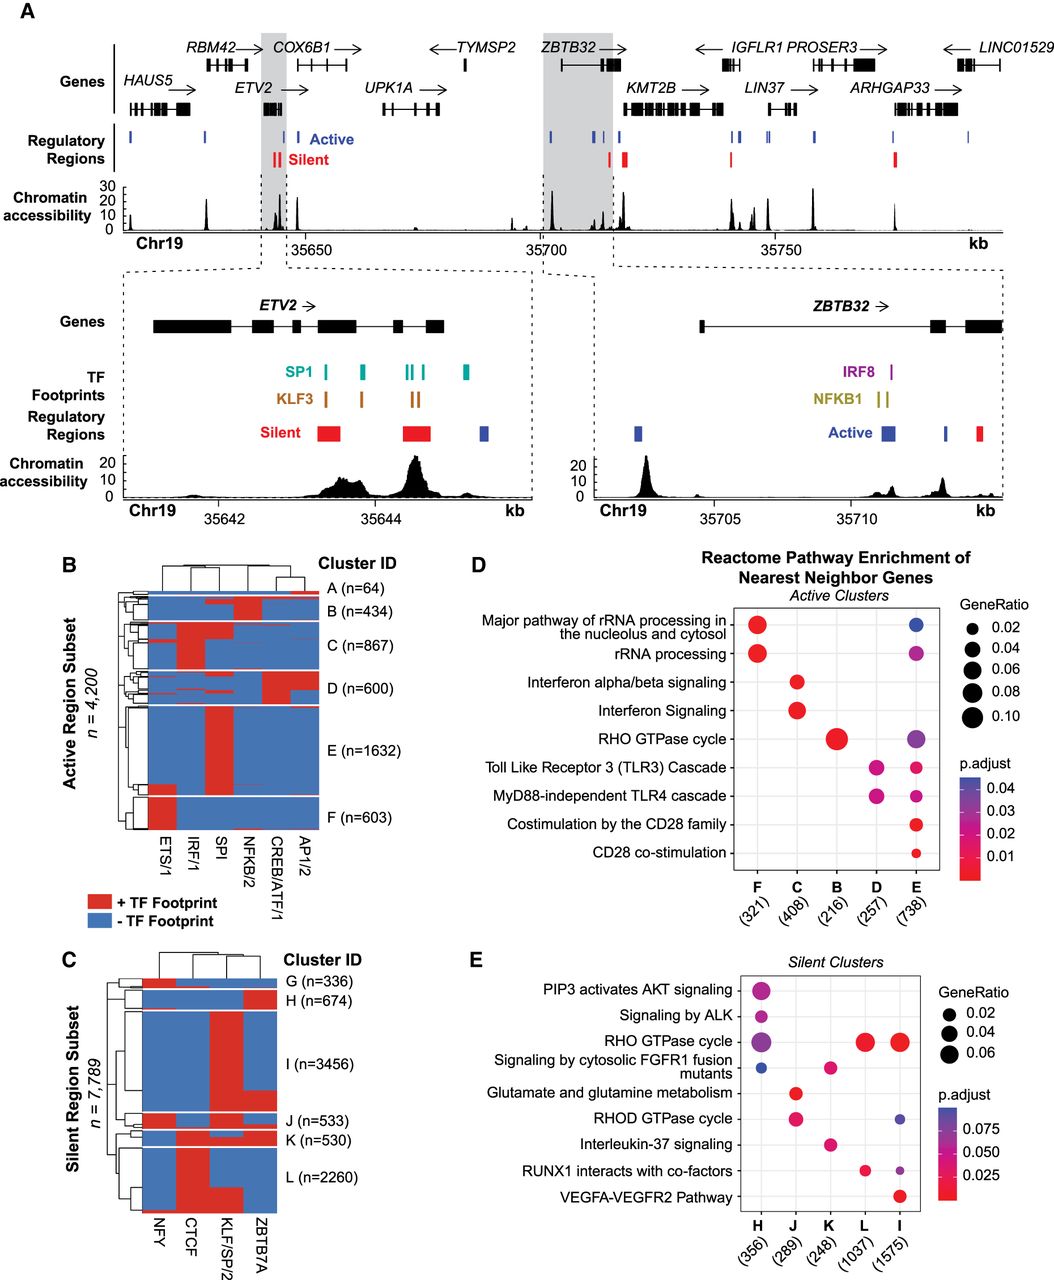
TF footprints stratify ATAC-STARR-defined regulatory regions into gene regulatory networks. (A) ATAC-STARR-defined chromatin accessibility, TF footprints, and regulatory regions at Chr 19: 35,611,232–35,798,446 (hg38). Signal tracks represent counts per million normalized read depth of chromatin accessibility. Zooms into ETV2 and ZBTB32 show that some regulatory regions are occupied by a SP1, KLF3, IRF8, or NFKB1 footprint. (B,C) Heat maps of clustered (B) active and (C) silent regions based on presence or absence of footprints for select TF motif archetypes. (D,E) Reactome pathway enrichment analysis for nearest-neighbor gene sets for each of the clusters. Genes counts for each cluster are displayed below their group identifier.


