
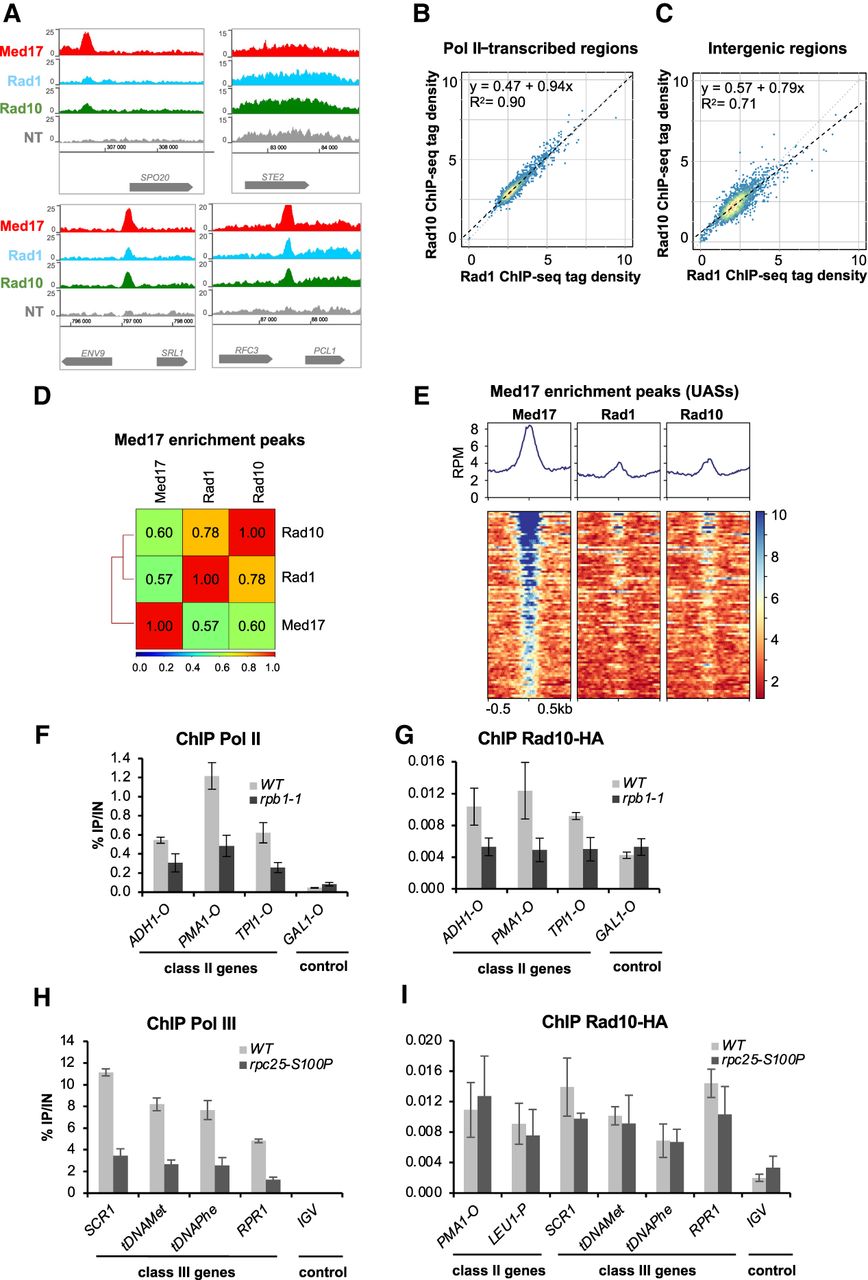
Genome-wide analysis of Rad1 and Rad10 occupancy. (A) Examples of Rad1, Rad10, and Mediator (Med17) tag density profiles in the WT context on Pol II–transcribed and intergenic regions. Nontagged (NT) control is also included. (B,C) Rad10 ChIP-seq density versus Rad1 ChIP-seq density on Pol II–transcribed regions (B) and intergenic regions (C). Each point on the plot corresponds to one transcribed or intergenic region. A linear regression (dotted line) and an R2 linear regression coefficient are indicated. The dashed line corresponds to y = x. (D) Pairwise Spearman's correlation coefficients (SCCs) of ChIP-seq data were calculated for Rad1, Rad10, and Mediator on Mediator (Med17) enrichment peaks (UASs). The colors correspond to the scale for SCCs indicated on the bottom. (E) Heat maps of Mediator (Med17), Rad1, and Rad10 ChIP-seq profiles centered on Mediator (Med17) enrichment peaks (−500 bp to +500 bp), sorted by decreasing Mediator occupancy. Median tag density profiles in RPM are shown in the upper panels. (F,G) Effect of the rpb1-1 Pol II mutation on Rad10 and Pol II occupancies at selected regions. Quantitative ChIP assays were performed using α-Rpb1 antibody (Pol II; F) and α-HA antibody against Rad10-HA (G). Cells were grown in selective SD medium complemented with amino acids at 25°C and then shifted for 90 min at 37°C. GAL1-O amplicon was used as a negative control. Quantities were normalized to qPCR performed on input DNA and are expressed as a percentage. The indicated value is the mean of three biological replicates, and error bars represent the standard deviation. (H,I) Effect of the rpc25-S100P Pol III mutation on Rad10 and Pol III occupancies at selected regions. Quantitative ChIP assays were performed using α-Myc antibody against Rpc160-13Myc Pol III subunit (H) and α-HA antibody against Rad10-HA (I). Cells were grown in selective SD medium complemented with amino acids at 25°C and then shifted for 10 h at 37°C. IGV amplicon (nontranscribed region on Chromosome V) was used as a negative control. Quantities were normalized to qPCR performed on input DNA and are expressed as a percentage. The indicated value is the mean of three biological replicates, and error bars represent the standard deviation.


