
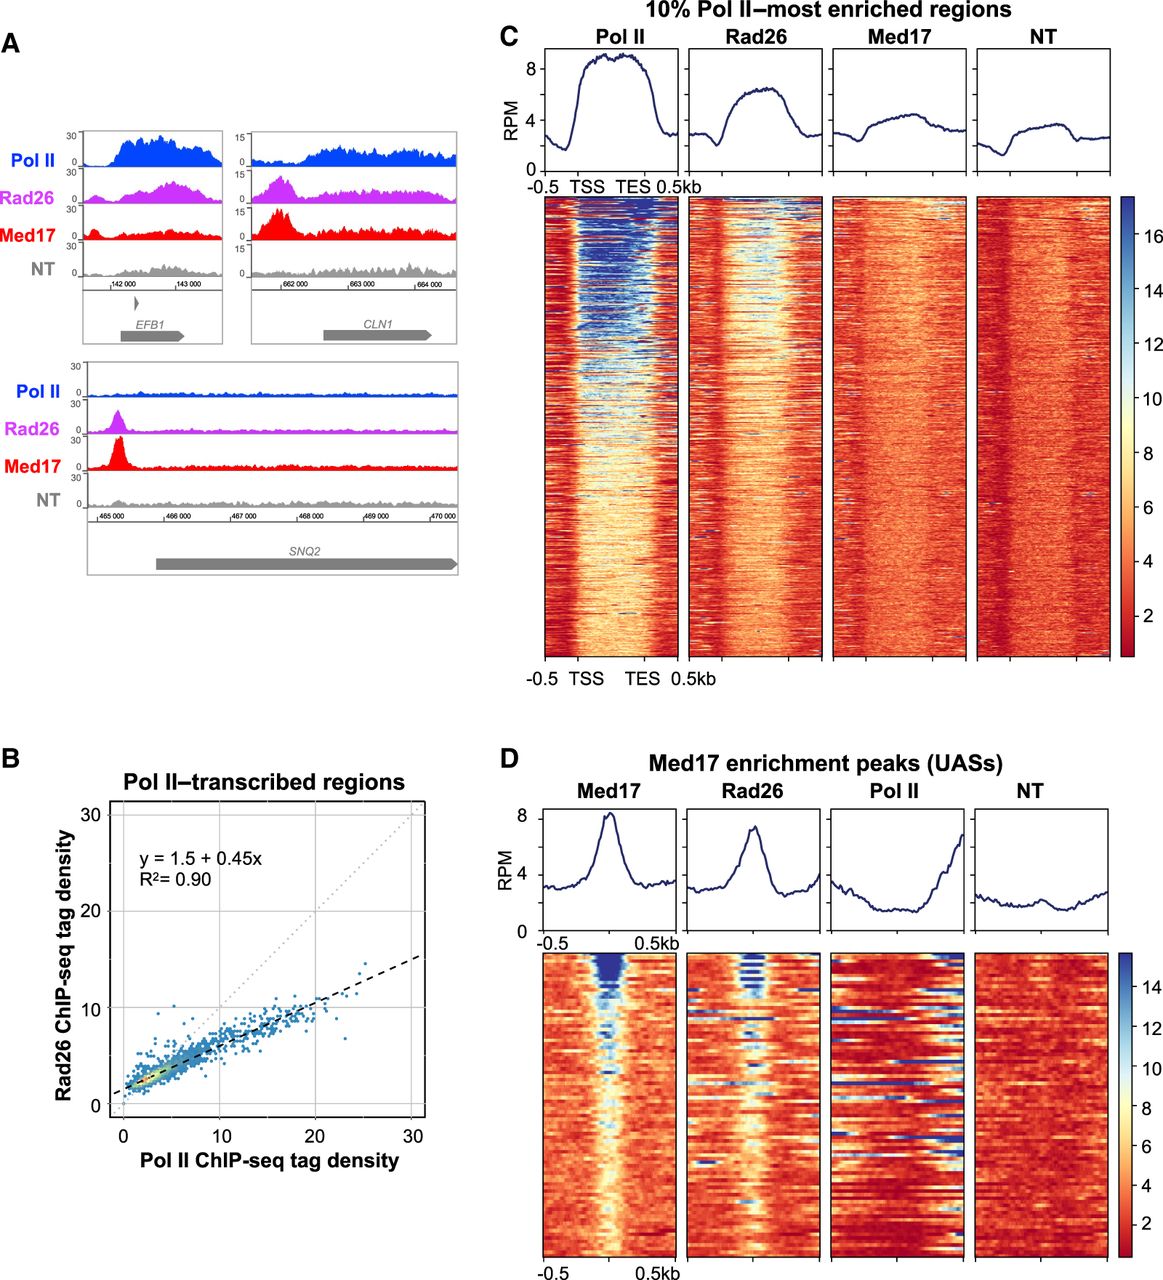
Genome-wide analysis of Rad26 occupancy. (A) Examples of Rad26, Pol II, and Mediator (Med17) tag density profiles in the wild-type (WT) context on Pol II–transcribed genes. Nontagged (NT) control is also included. (B) Rad26 ChIP-seq density versus Pol II ChIP-seq density on Pol II–transcribed genes. Each point on the plot corresponds to one transcribed region. A linear regression (dotted line) and an R2 linear regression coefficient are indicated. The dashed line corresponds to y = x. (C) Heat maps of Pol II, Rad26, and Mediator (Med17) ChIP-seq occupancy on the 10% Pol II–most enriched regions (scaled windows for 500 bp before TSS, between TSS and TES, and 500 bp after TES), sorted by decreasing Pol II occupancy. Median tag density profiles in reads per million (RPM) are shown in upper panels. NT control is also displayed. (D) Heat maps of Mediator (Med17), Rad26, and Pol II ChIP-seq occupancy centered on Mediator enrichment peaks (−500 bp to +500 bp; UASs), sorted by decreasing Mediator occupancy. Median tag density profiles in RPM are shown in upper panels. NT control is also displayed.


