
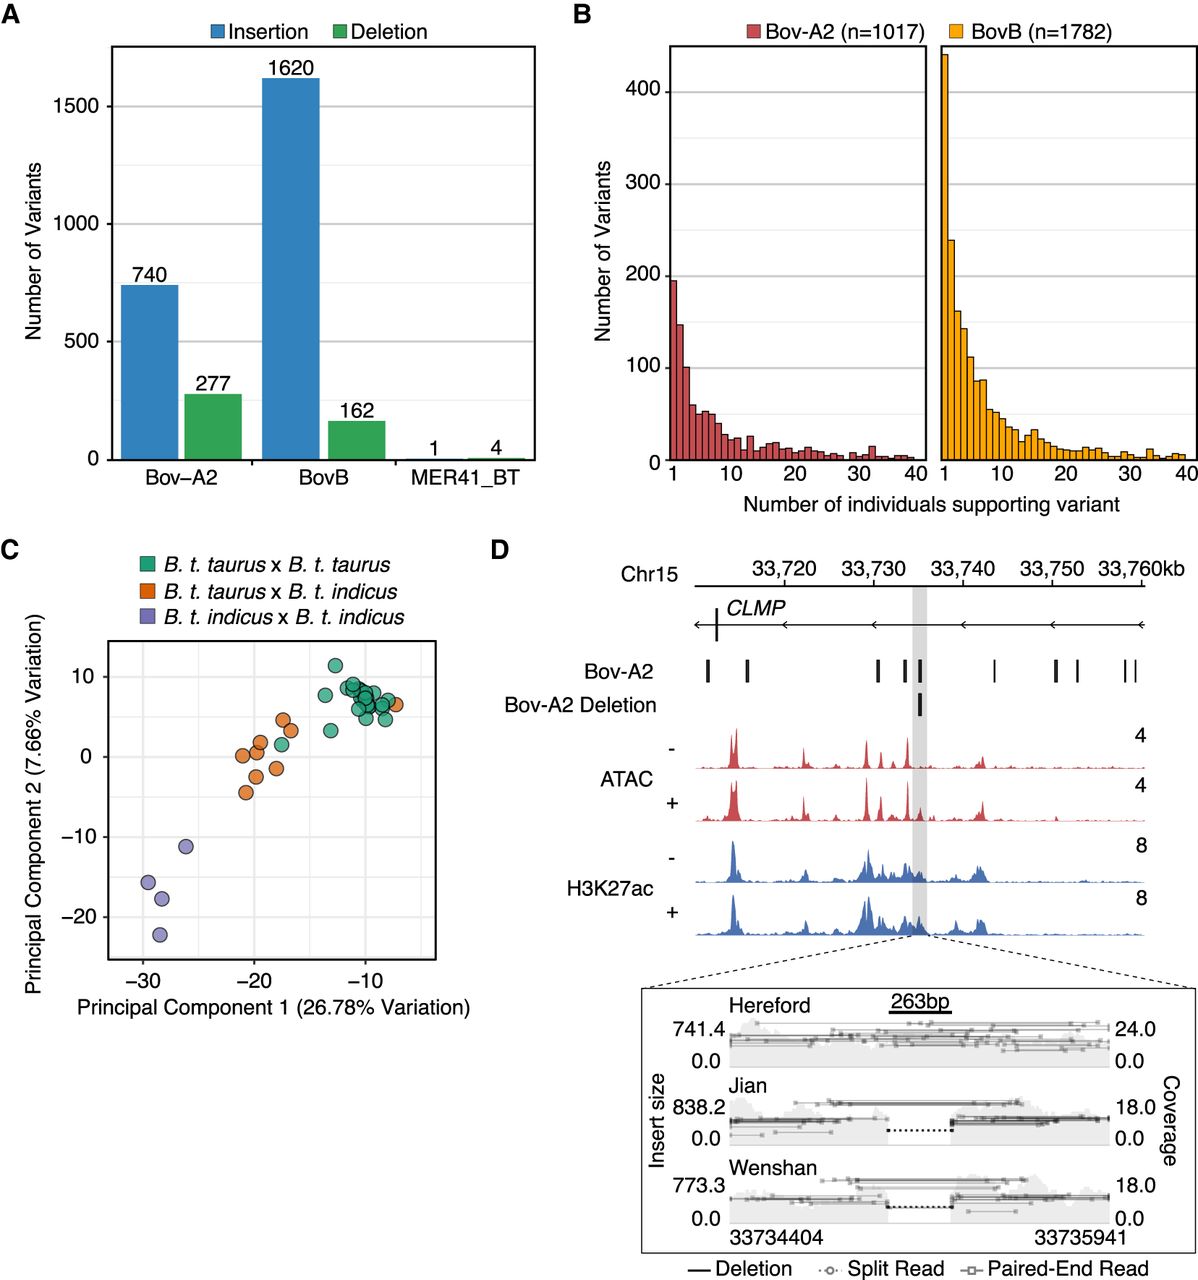
Detection of Bov-A2 insertion polymorphisms. (A) Number of polymorphic Bov-A2, BovB, and MER41_BT insertions (blue) and deletions (green) for each TE family. (B) Histogram of polymorphic Bov-A2 variants as a function of the number of individuals supporting each variant. Individuals were defined as supporting a variant if they showed evidence of at least one variant allele. (C) Histogram of polymorphic BovB variants as a function of number of individuals supporting each variant. (D) Genome Browser view of a putative Bov-A2 deletion (Chr 15: 33,735,041–33,735,304) intronic to CLMP. ATAC-seq and CUT&RUN tracks from MDBK are normalized per million reads. Values on the right of each track correspond to signal maxima. Variant visualization plot was produced using Samplot (Belyeu et al. 2021) and depicts aligned fragments from three individuals over the predicted Bov-A2 deletion.


