
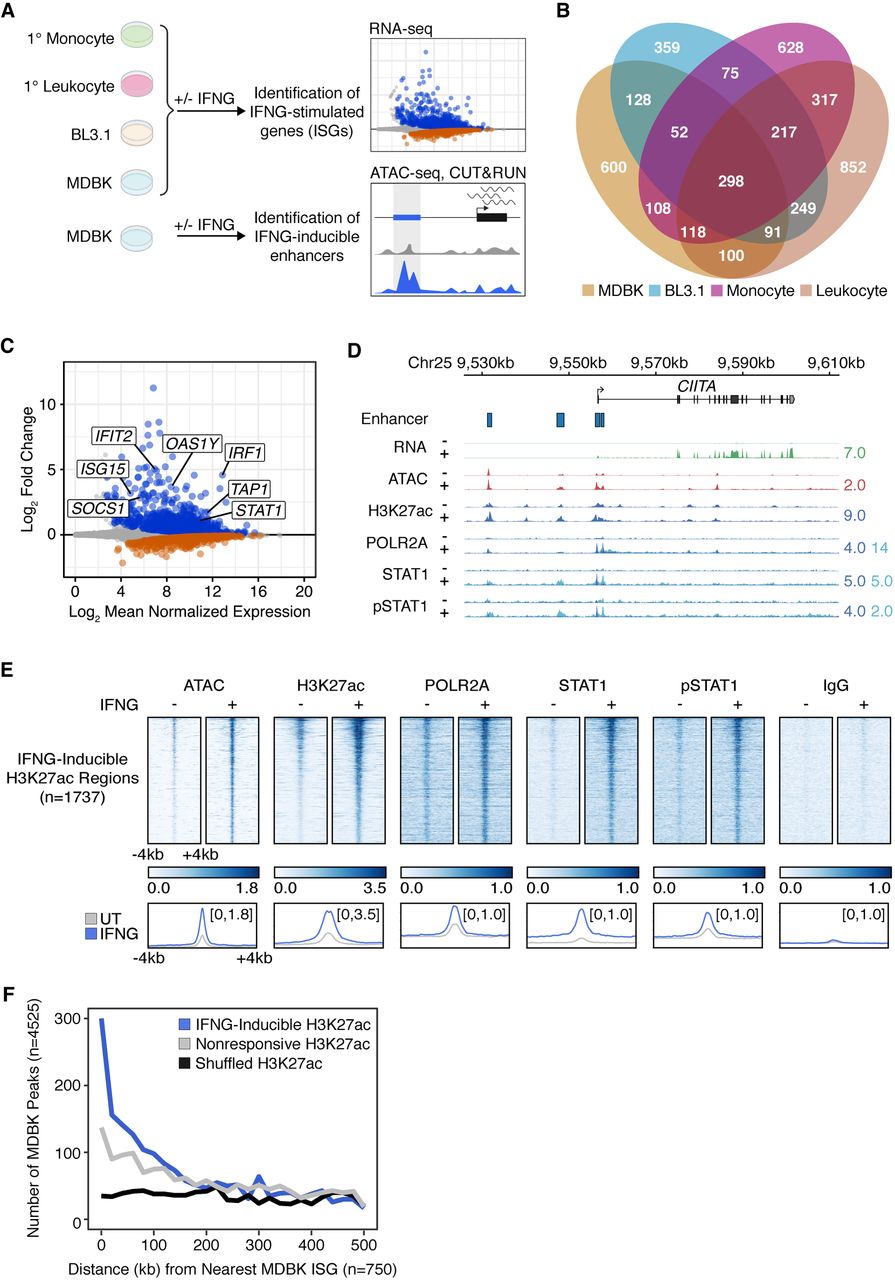
Epigenomic profiling of the bovine type II IFN response. (A) Schematic of experimental design. Created with BioRender.com. (B) Venn diagram of ISGs as defined by RNA-seq from MDBK, BL3.1, monocytes, and leukocytes. (C) MA plot of ISGs (blue) and IRGs (orange) from MDBK RNA-seq. Genes with an FDR < 0.05 are shown in gray, and canonical ISGs are labeled. (D) Genome Browser view of the CIITA locus. MDBK RNA-seq, ATAC-seq, and CUT&RUN tracks are CPM-normalized. CUT&RUN tracks for POLR2A, STAT1, and phosphorylated STAT1 pulldowns are colored by aligned fragments ≤150 bp (dark blue) and >150 bp (light blue). The H3K27ac tracks correspond to all aligned fragments. Predicted IFNG-inducible enhancers are shown. Signal track maxima are indicated to the right of each track. (E) Heat maps showing CPM-normalized MDBK CUT&RUN signal over IFNG-inducible H3K27ac (n = 1737) peaks sorted by ascending FDR. Bottom metaprofiles depict average normalized CUT&RUN signal across loci. (F) Frequency histogram of absolute distances from each MDBK peak to the nearest MDBK ISG. (ISG) Interferon-stimulated gene.


