
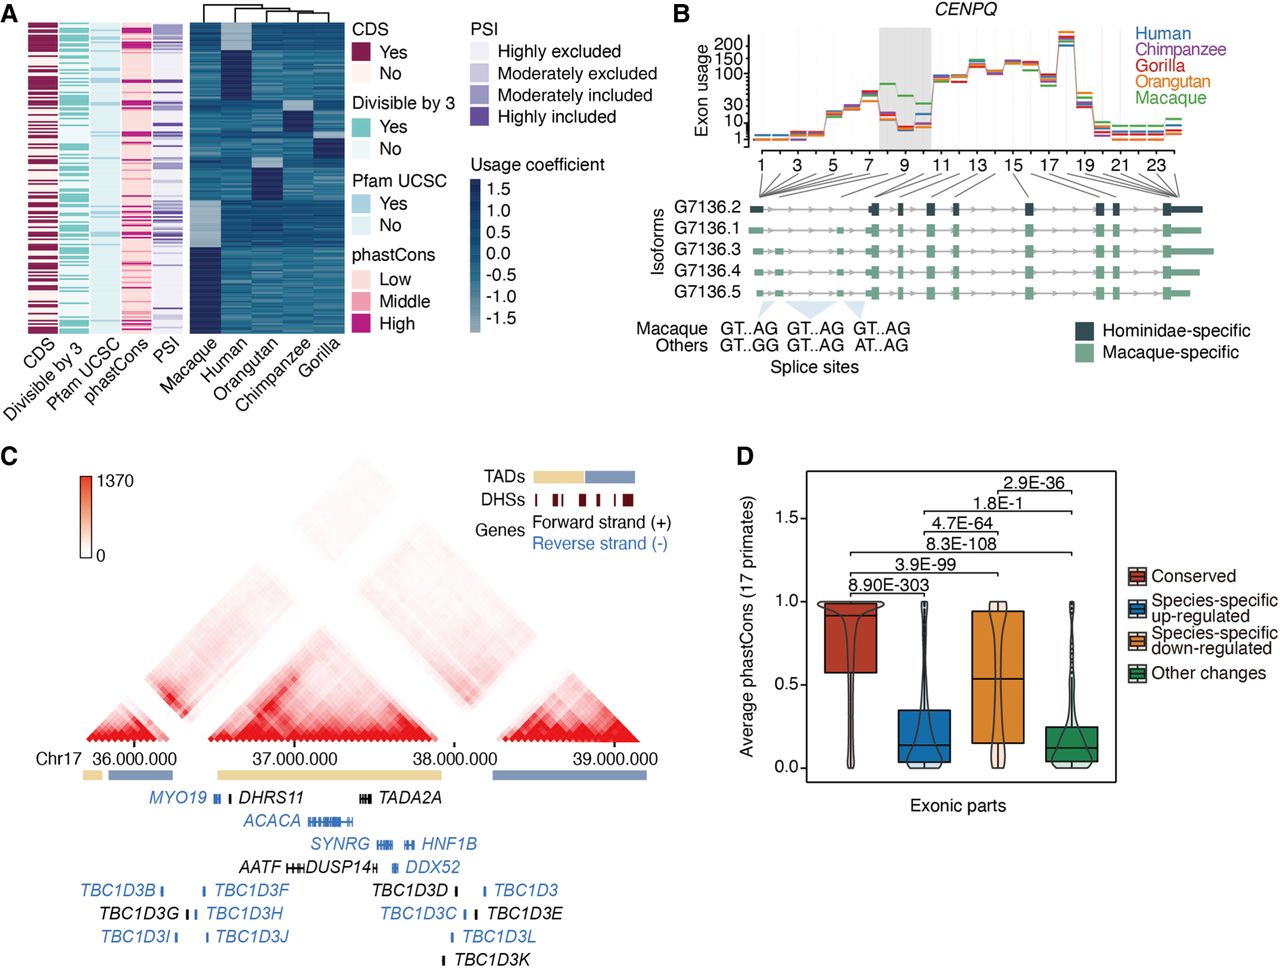
Exon usage dynamics across primates. (A) Usage coefficients for skipping exons displaying species-specific changes (row-wise scaled). Overlap with coding sequence (CDS) and Pfam protein domains (UCSC), divisibility by three, average percentage-splice-in (PSI), and average phastCons scores are shown for each exon (see Supplemental Methods). (B) Example of gene (CENPQ) with different splice sites in macaque and great apes. Exon usage coefficients are illustrated at the top. Hominidae- and macaque-specific Iso-Seq transcripts are color-coded (bottom). (C) Chr17q12 region with high density of human-specific DEU. Hi-C interaction intensity is indicated in the color legend. Gene orientation, DNase hypersensitive sites (DHSs), and topologically associating domains (TADs) are also displayed. (D) Average conservation score in primates for exonic parts with conserved usage (N = 95,453), species-specific up-regulation (N = 941) or down-regulation (N = 1340), and exonic parts showing other usage changes (N = 277). “Other changes” correspond to usage differences between groups of species (e.g., any two species show differential usage vs. the remaining three species). Exonic parts longer than five bases (all included as passed in 1000 Genomes hg38 strict mask) are shown. Statistical significance of the difference across groups was assessed by the Wilcoxon test, and shown P-values are adjusted by the Holm method.


