
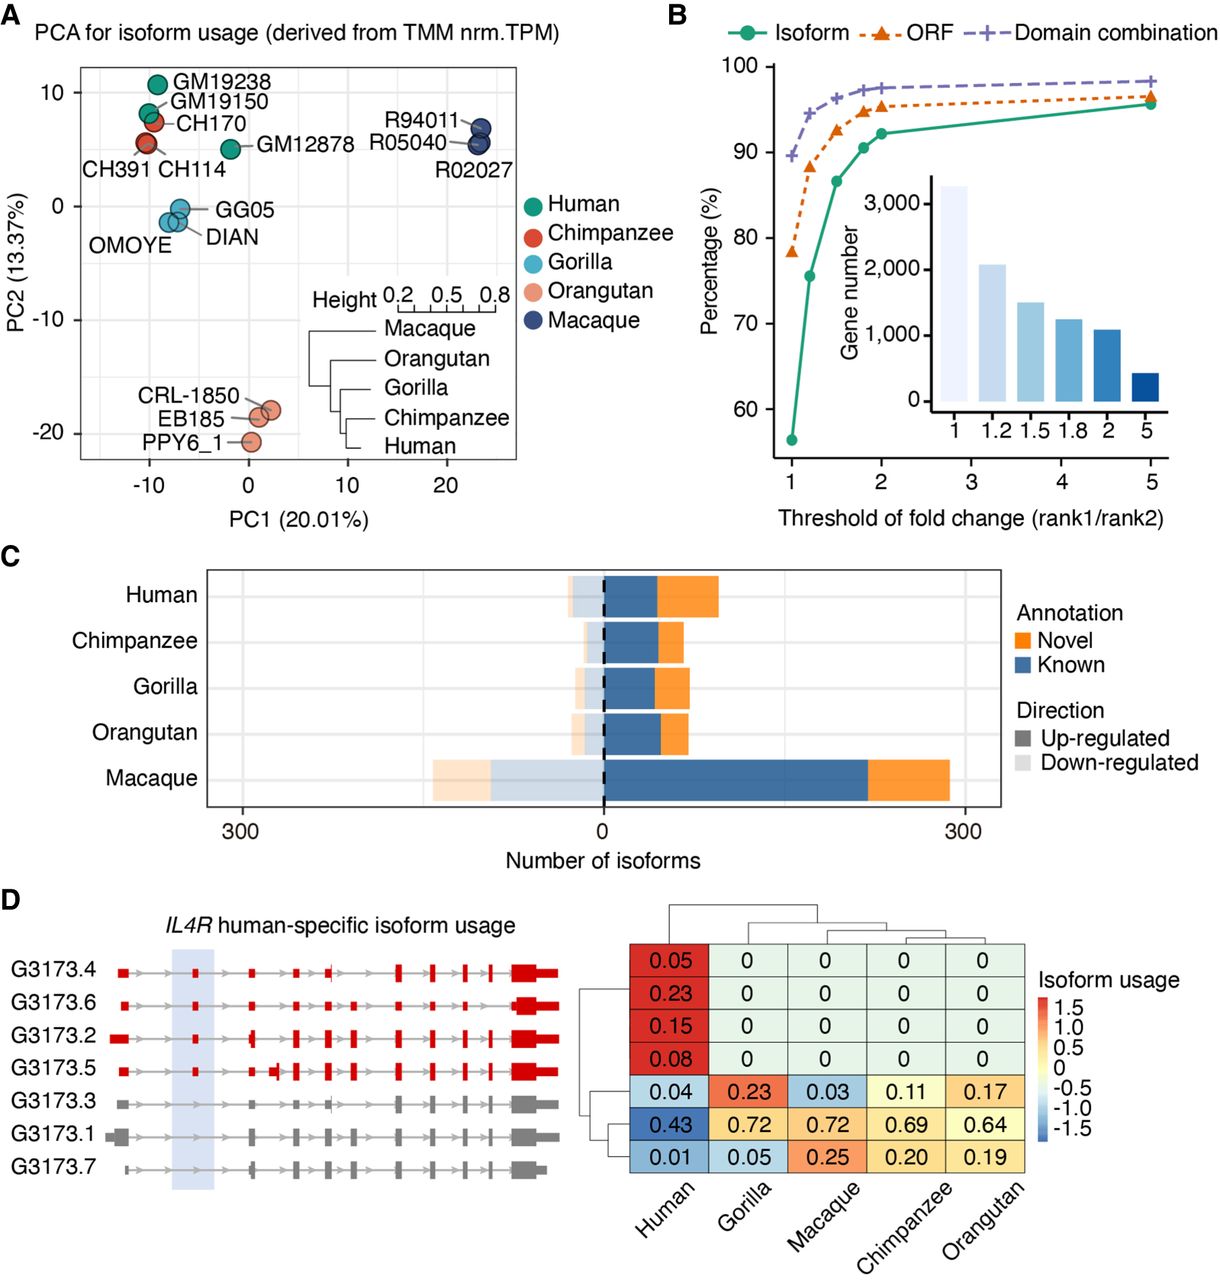
Isoform usage (IU) dynamics across primates. (A) Principal component analysis (PCA) for isoform fraction values of 43,484 transcripts from one-to-one orthologous genes. A hierarchical clustering for the Euclidean distances of IU Spearman's correlations across samples is also shown. IU values were calculated from transcripts per million (TPM) after batch effect correction (comBat) and trimmed mean of M-values (TMM) normalization (Supplemental Methods). (B) Percentage of rank 1 isoform (green), ORF (orange), and protein domain combination (purple) shared by all primates by different thresholds of expression fold change between rank 1 and rank 2 isoforms. The number of genes considered for each threshold is indicated in the inner bar plot. (C) Number of isoforms showing species-specific usage changes. Up-regulated (dark shadow) and down-regulated (light shadow) isoforms are classified into novel (orange) and known (blue) isoforms based on the reference transcriptome in the corresponding species (NHP novel assemblies). (D) IL4R human-specific IU. Human-specific up-regulated isoforms are colored in red; nondifferentially used isoforms, in gray (left). IU values across species are shown in the heatmap (right), where colors represent row-scaled IU values (legend).


