
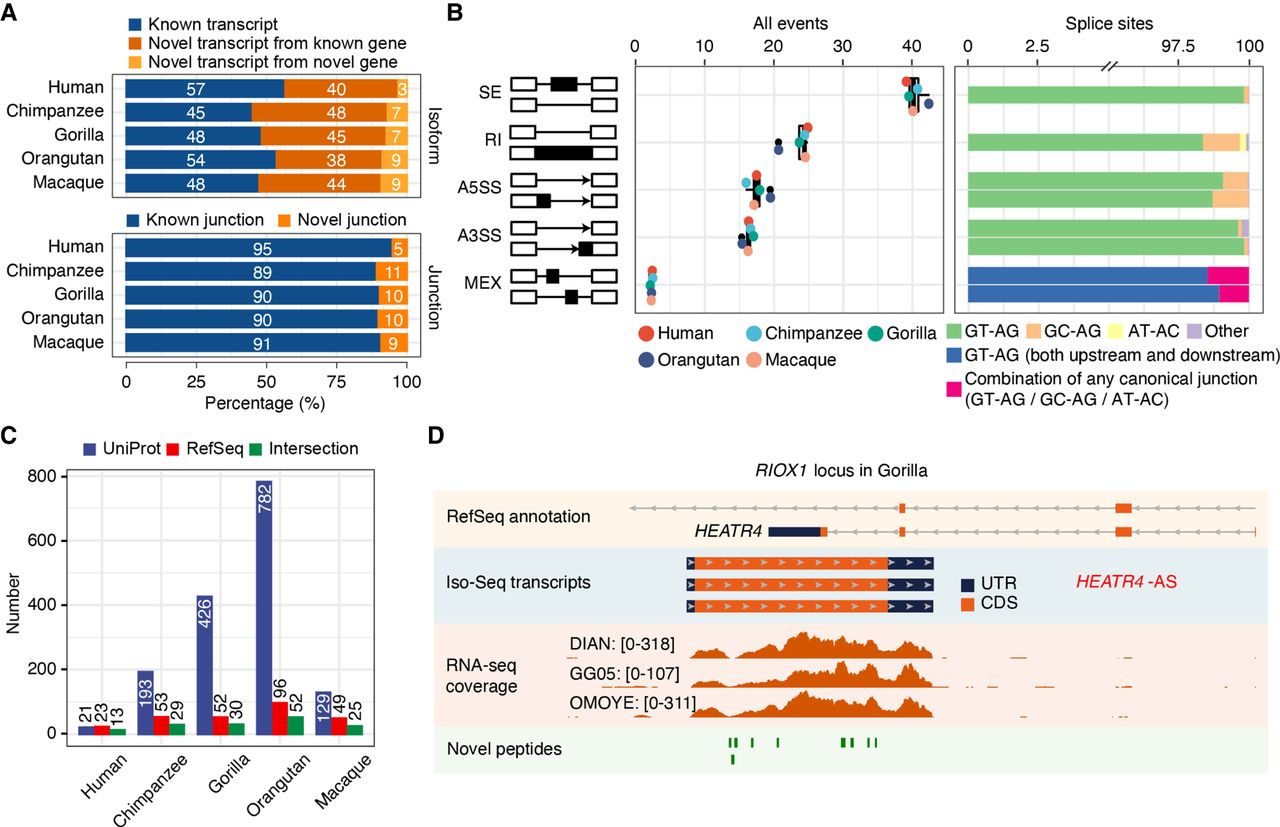
Isoform sequencing and mass spectrometry proteomics largely improve reference annotations. (A) Percentage of known versus novel transcripts (top) and junctions (bottom) captured by Iso-Seq (Ensembl V91). (B) Percentage of alternative splicing (AS) events detected by Iso-Seq (left) and percentage of splice site combinations associated with each AS class (right). (SE) Skipping exons, (RI) retained introns, (A5SS) alternative 5′ splice sites, (A3SS) alternative 3′ splice sites, (MEX) mutually exclusive exons. (C) Number of annotated genes with novel detected peptides in each species for UniProt reference proteomes, NCBI RefSeq CDS annotations, or both. UniProt annotations are based on hg38, panTro5, gorGor4, ponAbe2, and rheMac8. NCBI RefSeq CDS annotations are based on hg38, panTro6, gorGor6, ponAbe3, and rheMac10. Peptides mapping to multiple isoforms are included. (D) Example of an unannotated gene (RIOX1 locus shown in gorGor6 assembly) supported by Iso-Seq, RNA-seq, and mass spectrometry in gorilla samples. [Minimum–maximum] intervals for the number of mapped RNA-seq reads are represented for each gorilla LCL.


