
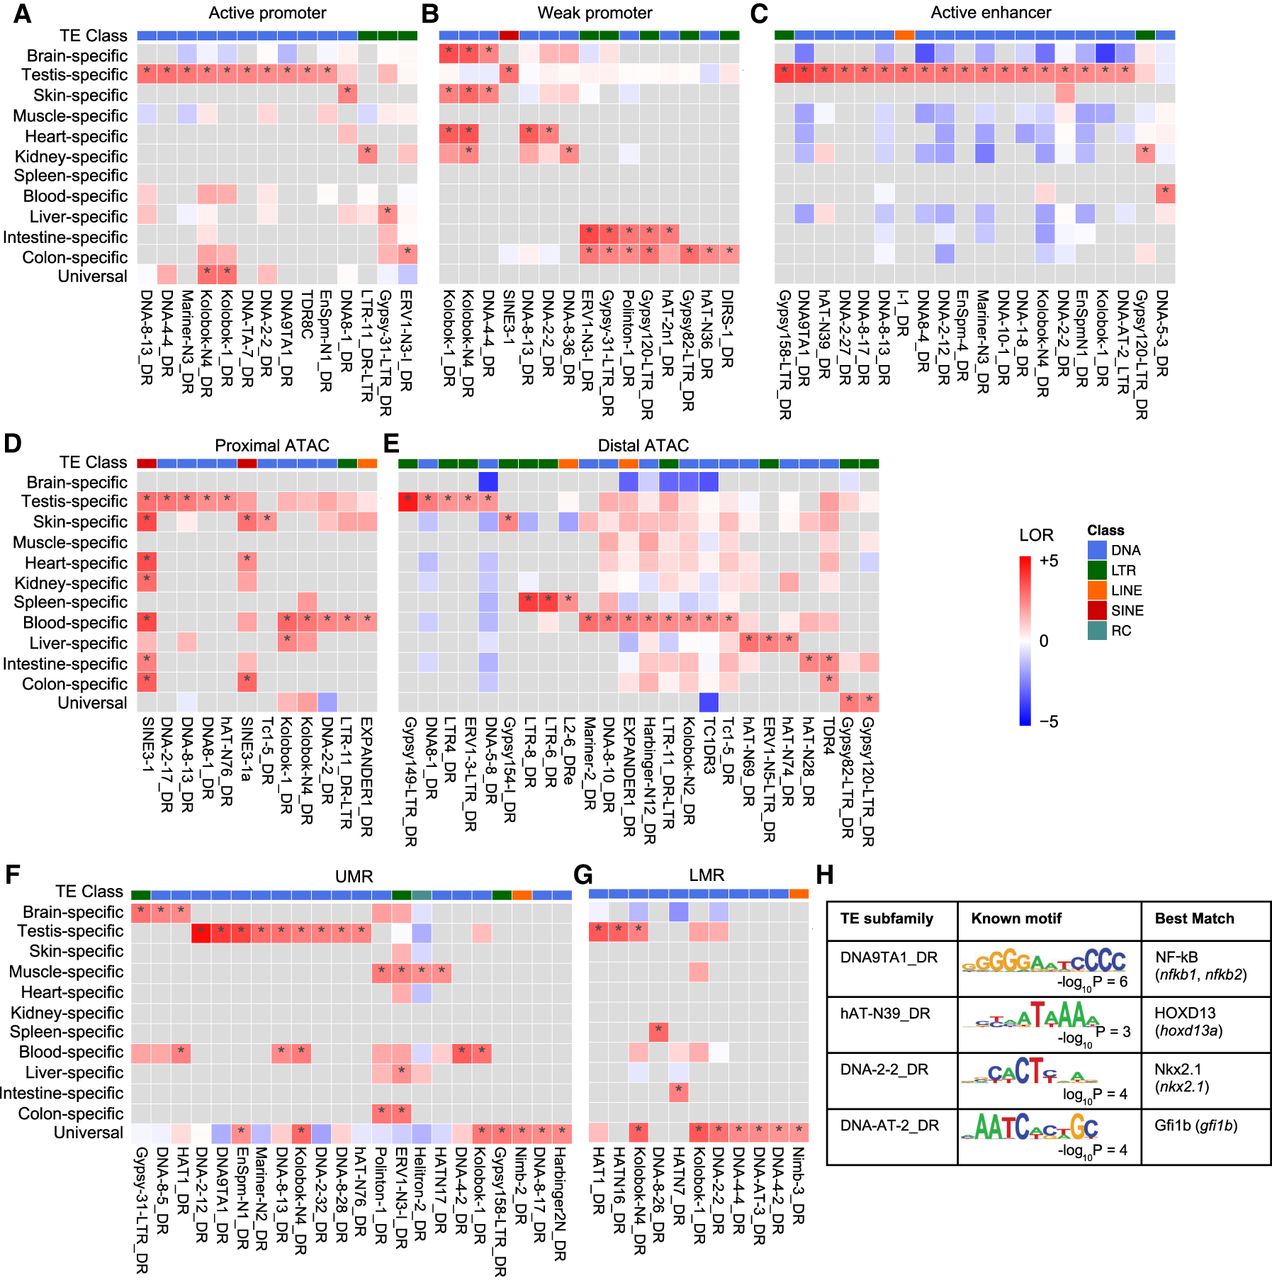
Figure 3.
Heat map of tissue-specific enrichment of TE subfamilies in epigenetic states. (A) Active promoter. (B) Weak promoter. (C) Active enhancer. (D) Proximal ATAC-seq peaks. (E) Distal ATAC-seq peaks. (F) UMRs. (G) LMRs. (LOR) Log odds ratio, (*) FDR < 0.05 from permutation test with Benjamini–Hotchberg multiple testing corrections. (H) Known motifs of TE subfamilies enriched in testis-specific enhancer regions.


