
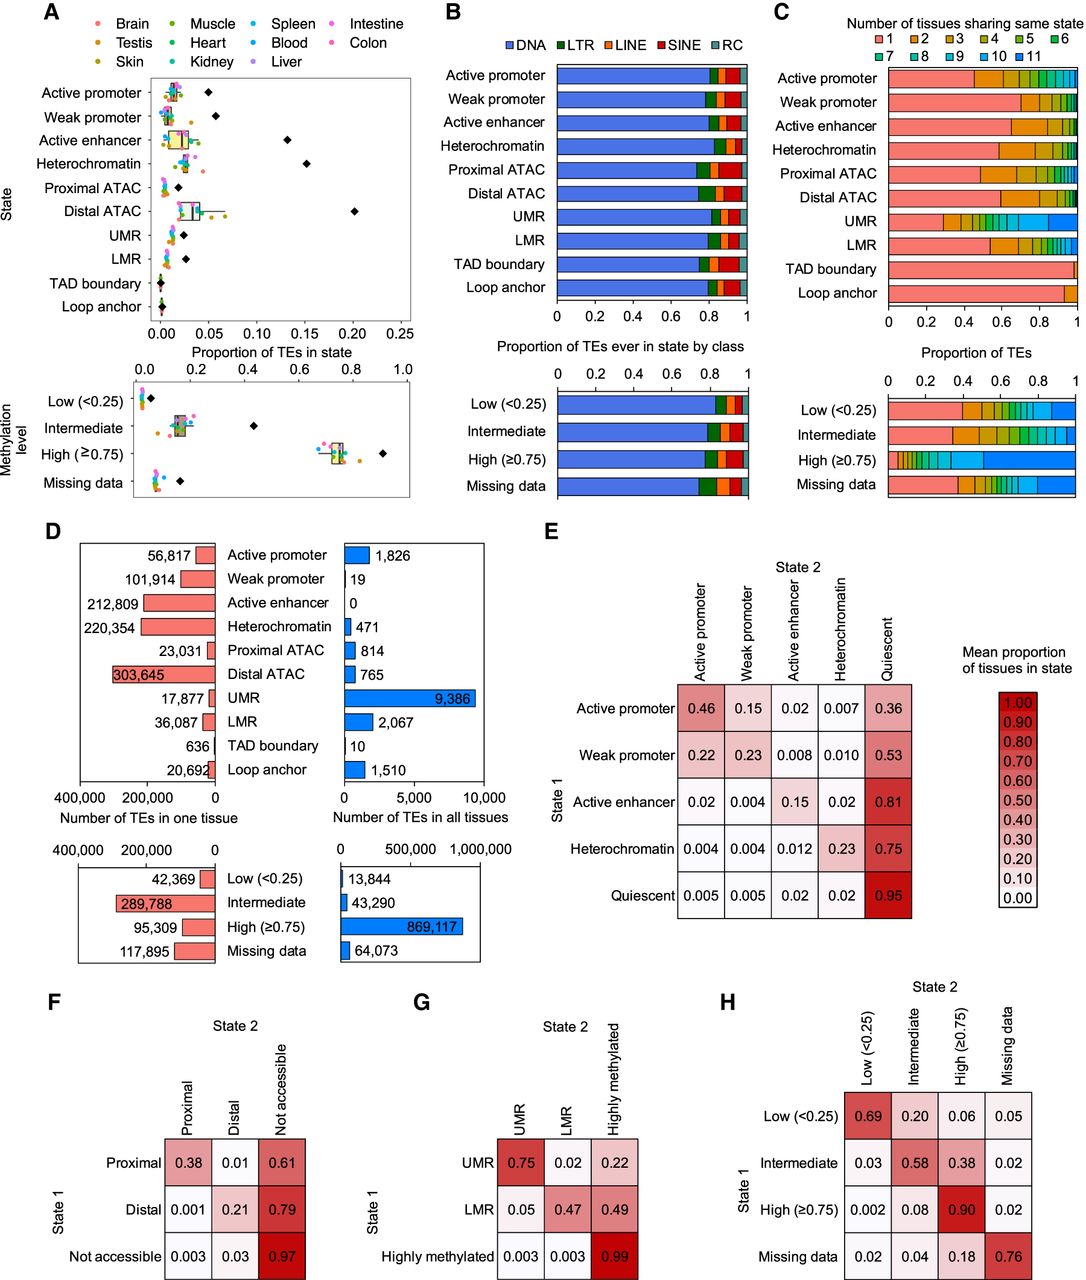
Epigenetic state dynamics of zebrafish TEs. (A) Boxplots indicate the proportion of all 2,532,468 individual TE fragments annotated by epigenetic state per tissue (n = 11 tissues, except for TAD boundary and loop anchor, n = 2). Black diamonds are the fraction of TEs annotated with the state in at least one tissue. For methylation level states, only TEs with CpGs are included (1,941,161 TE fragments, 77% of all TEs). (B) For TEs annotated with the epigenetic state in at least one tissue (A, black diamonds), the proportion in each TE class. (C) The proportion of TEs annotated with the same states across different tissues. (D) Number of TEs annotated by state only in one tissue (left) and annotated by state in all 11 tissues (in all, two tissues for TAD boundary and loop anchor). (E–H) For TEs in epigenetic State 1 in at least one tissue, the mean proportion of tissues in which they are annotated with epigenetic State 2 (represented by color scale). Different categories of epigenetic states, including chromatin states (E), ATAC-seq peaks (F), UMRs and LMRs (G), and methylation levels (H), are used.


