
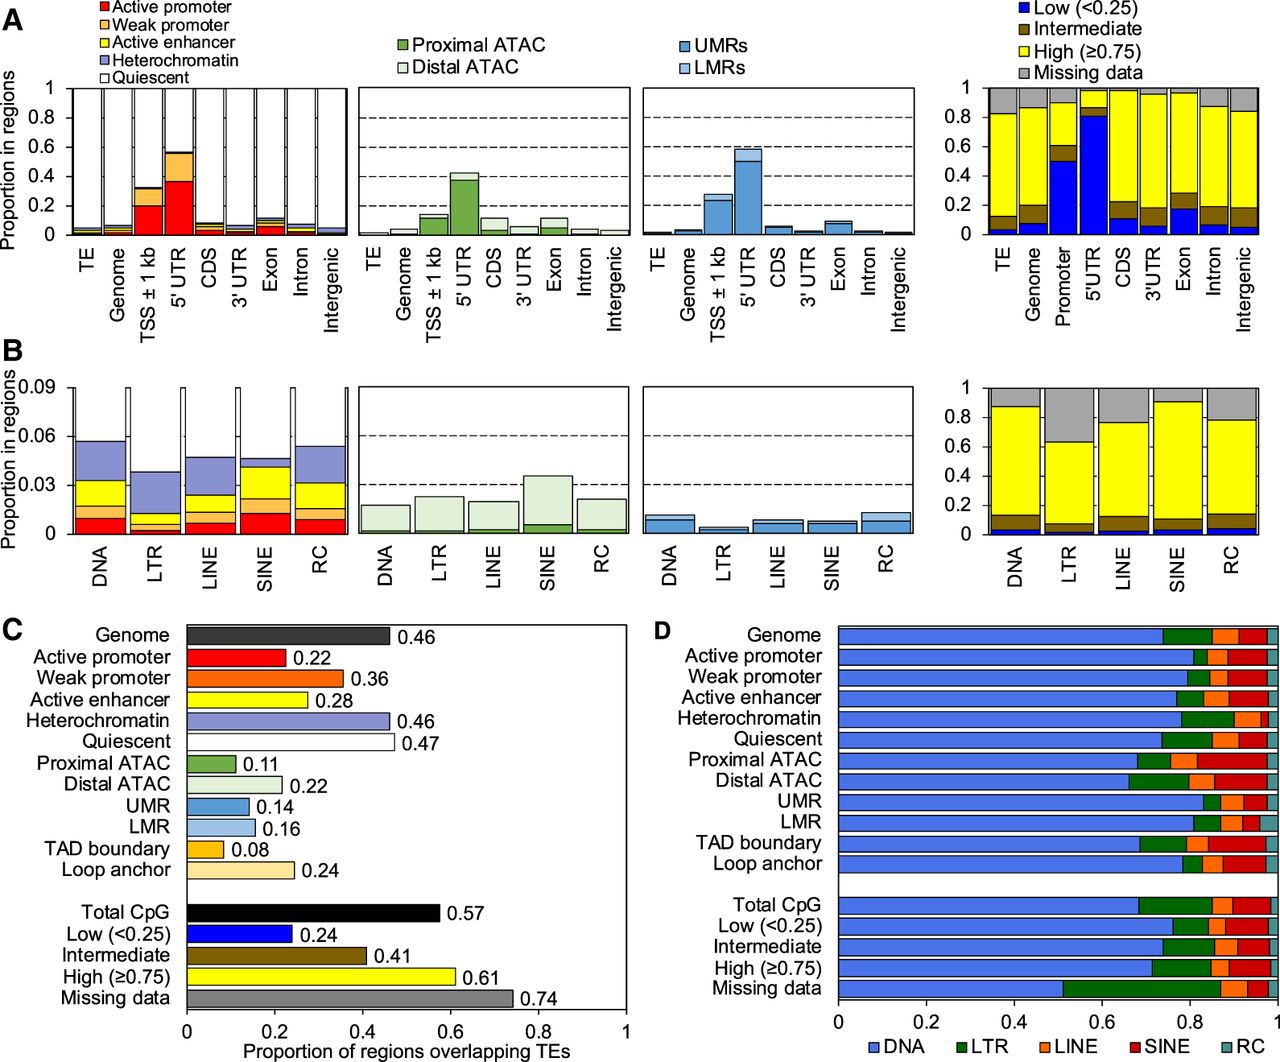
Substantial contribution of TEs to zebrafish CREs. (A) The proportion of bases within TEs, the entire genome, and Ensembl genic features annotated with each chromatin state (leftmost), ATAC-seq peak (mid-left), UMR or LMR (mid-right), and proportion of CpGs annotated with methylation state (rightmost), summed across all tissues with data for each category. (TSS) Transcription start site, (UTR) untranslated region, (CDS) coding sequences. (B) The proportion of bases within each TE class annotated by epigenetic state, summed across all tissues with data for each category. The color legend is the same as in A. (C) The total proportion of epigenetic states within TEs across all tissues versus the total proportion of all genomic bases and CpGs within TEs (black bars). (D) The proportion of each bar in C by TE class.


