
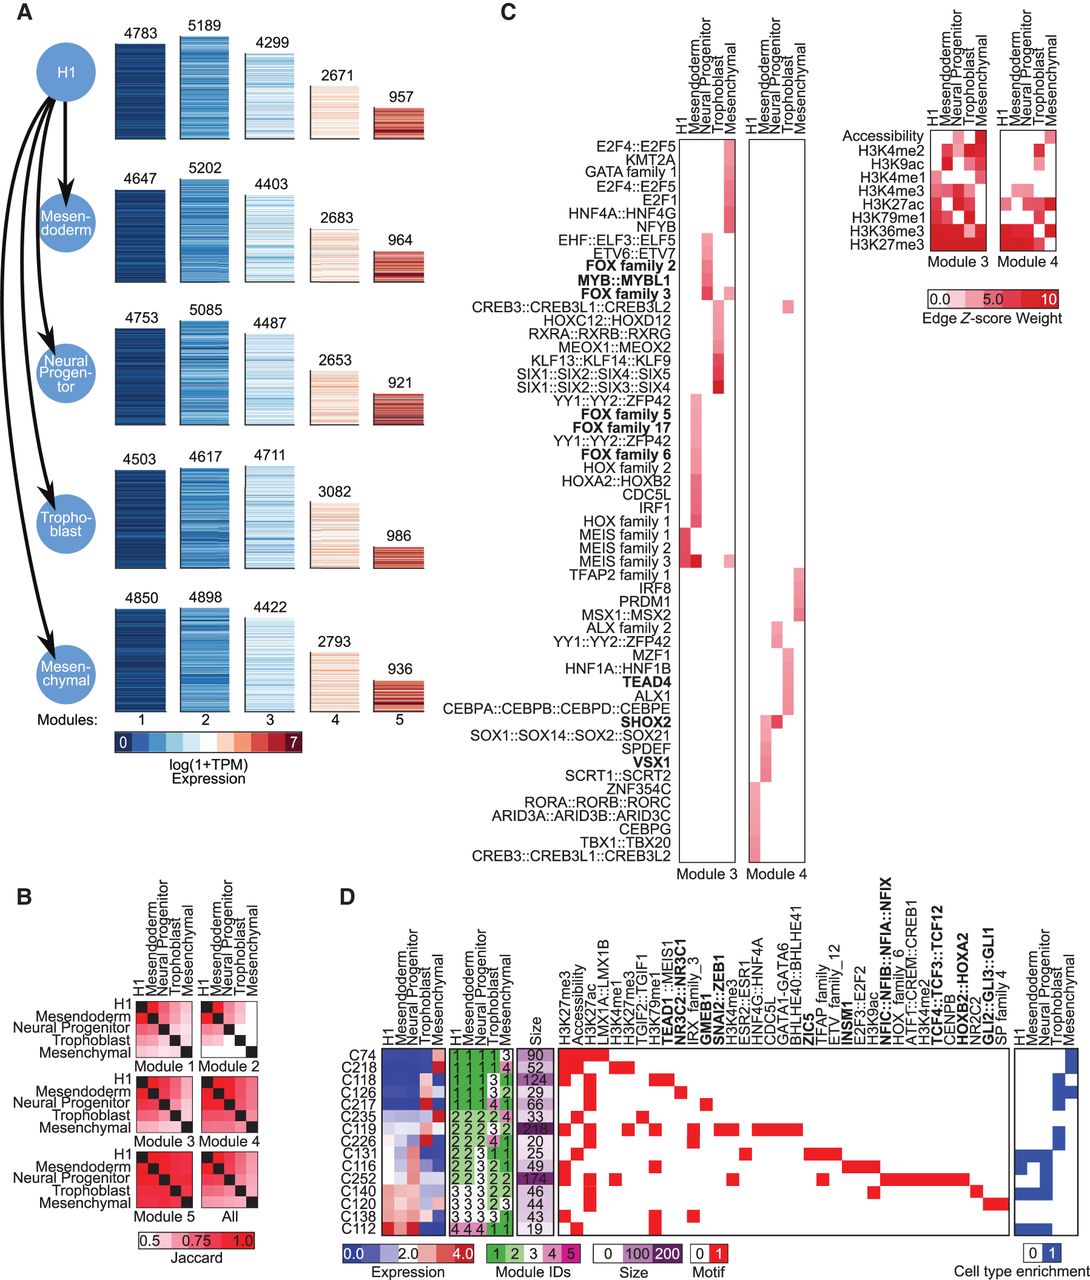
Application of DRMNs to ESC differentiation data set using histone marks, accessibility, and Q-motifs. (A) Shown are gene expression (log 1 + TPM) patterns of the k = 5 modules for each lineage (major row). The number above the heatmap is the number of genes in that module. The color corresponds to the level of expression, with more red denoting high expression and more blue denoting low expression. (B) Similarity of modules across lineages as measured by Jaccard index. The color intensity is proportional to the module match. (C) Inferred regulators for each module across time. Only modules with highest expression (3 and 4) and that had TFs as regulators are shown. The red intensity is proportional to the z-score significance of the regression weight of a regulator. For all values, see Supplemental Table S6. (D) Selected transitioning gene set profiles showing changes into the high expression modules (3, 4, 5). Shown are the mean expression levels of genes in the gene set (left; red–blue heatmap), the module assignment (second), the number of genes in each module (third), the set of regulators for each gene set (white–red heatmap), and enrichment in lineage-specific gene sets from Xie et al. (2013). The complete transitioning gene set is shown in Supplemental Figure S14. Some of the regulator names were shortened for space; the full names are available in Supplemental File S7. Bolded names are those discussed in the text.


