
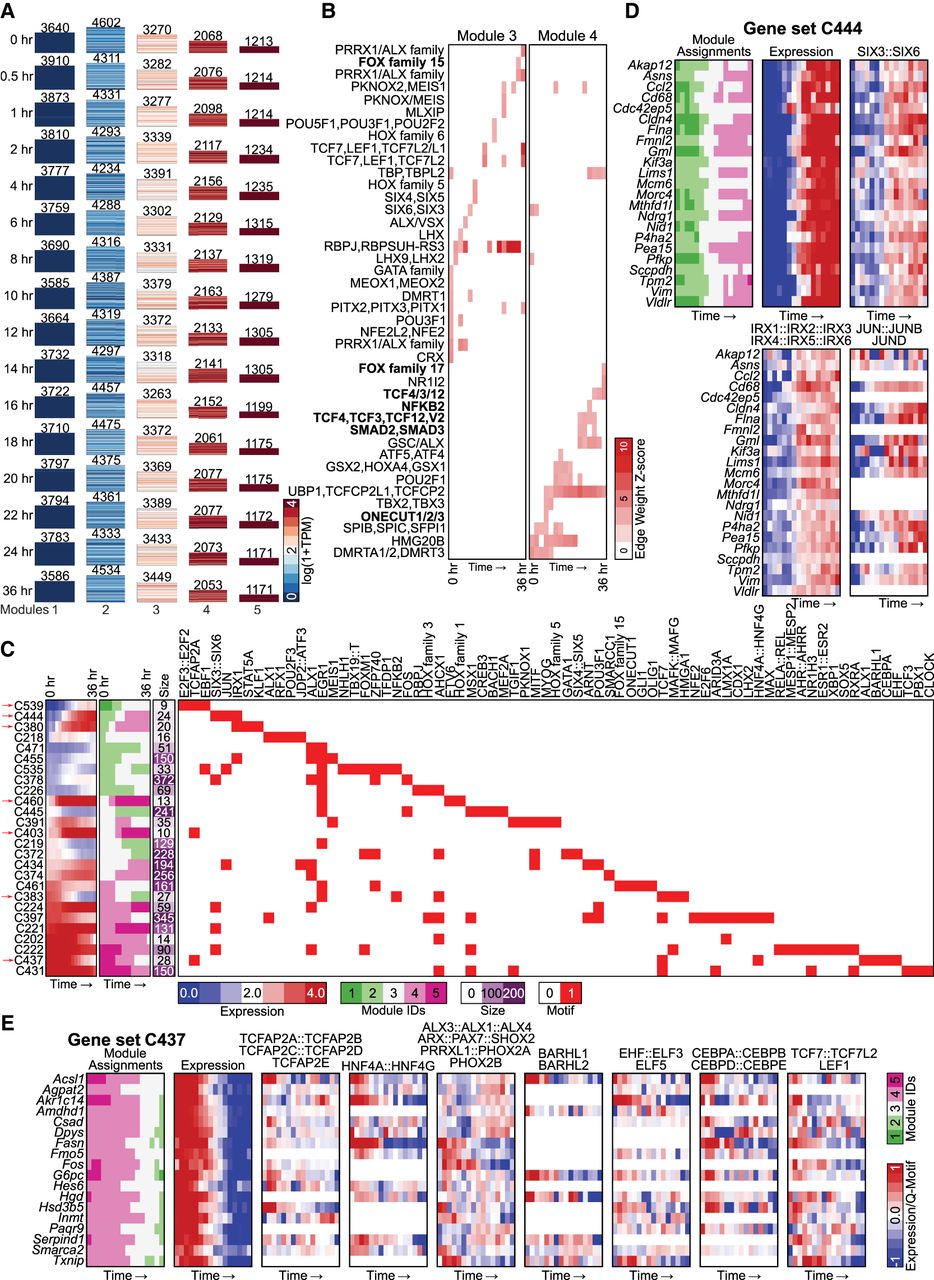
Application of DRMNs to the hepatocyte dedifferentiation data set using accessibility and Q-motifs. (A) Shown are gene expression (log 1 + TPM) patterns of the k = 5 modules for each time point (major row). The number above the heatmap is the number of genes in that module. The color corresponds to the level of expression, with more red denoting high expression and more blue denoting low expression. (B) Inferred regulators for each module across time. Only modules with highest expression and that had TFs as regulators (3 and 4) are shown. The red intensity is proportional to the z-score significance of the regression weight of a regulator. For all values, see Supplemental Table S6. Bolded names are those discussed in the text. (C) Transitioning gene sets showing changes into the high expression modules (3, 4, 5). Shown are the mean expression levels of genes in the gene set (left; red–blue heatmap), the module assignment (second), the number of genes in each module (third), and the set of regulators for each gene set (white–red heatmap). Red arrows depict gene sets discussed in the text. Some of the regulator names were shortened for space; the full names are available in Supplemental File S7. (D,E) Selected transitioning gene sets in the hepatocyte dedifferentiation data set. Each panel shows the member genes of a transitioning gene set (label on top). The columns show the module assignment of each gene, followed by its expression level in each cell type (Expression). The subsequent groups of columns are the levels of the regulator on the gene promoters. The name of the regulator is specified at the top of the heatmap. All significant regulators are shown.


