
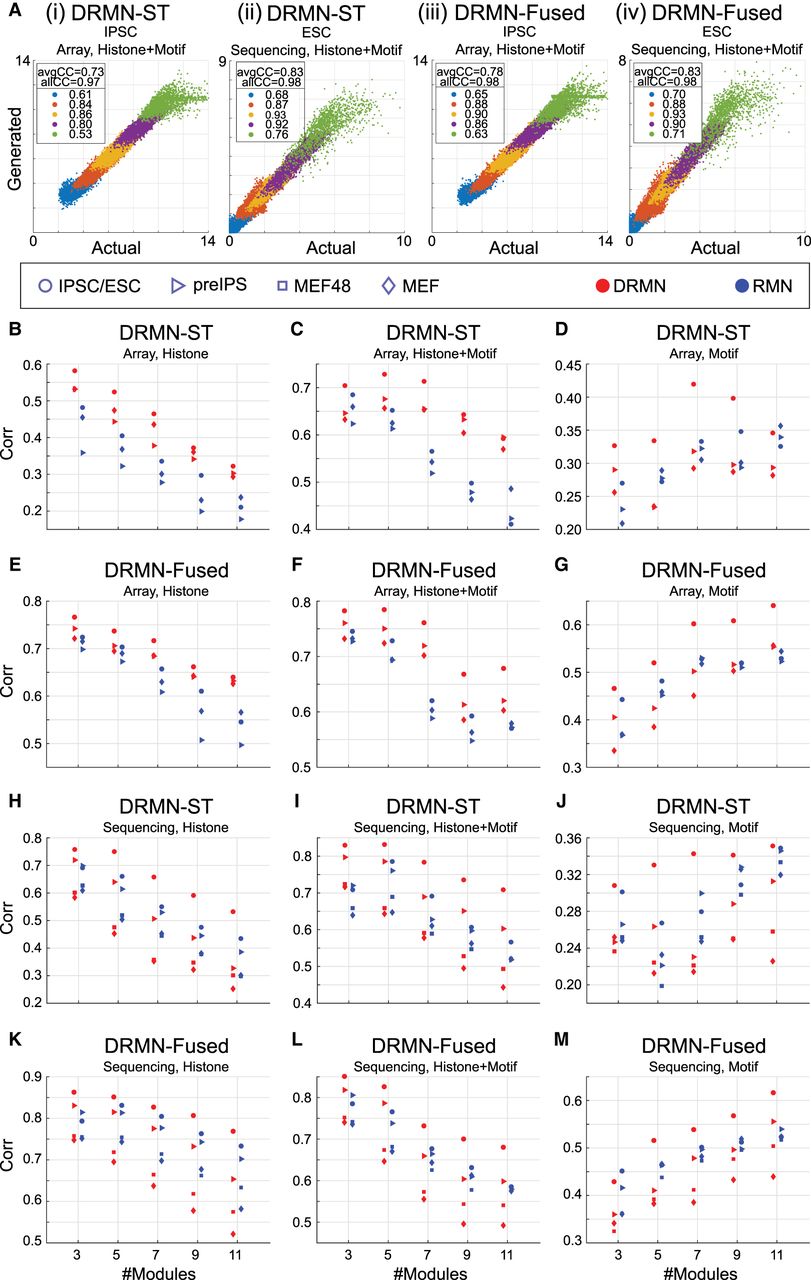
Comparing DRMN versus RMN models. (A) Predicted (generated) expression from a module versus measured (actual) expression, for iPSC/ESC, for (i) DRMN-ST on array data set, (ii) DRMN-ST on sequencing data set, (iii) DRMN-Fused on array data set, and (iv) DRMN-Fused on sequencing data set. Colors correspond to different modules. The values reported in the legend correspond to per-module correlation. (B–M) Average per-module correlation for individual cell lines as a function of different number of modules for single-task and multitask versions of the method, for DRMN-ST on array data set (B–D), DRMN-Fused on array data set (E–G), DRMN-ST on sequencing data set (H–J), and DRMN-Fused on sequencing data set (K–M). Each shape corresponds to a cell state, and each color corresponds to a different method. Note that for expression prediction, the generative models need the information about the observed expression.


