
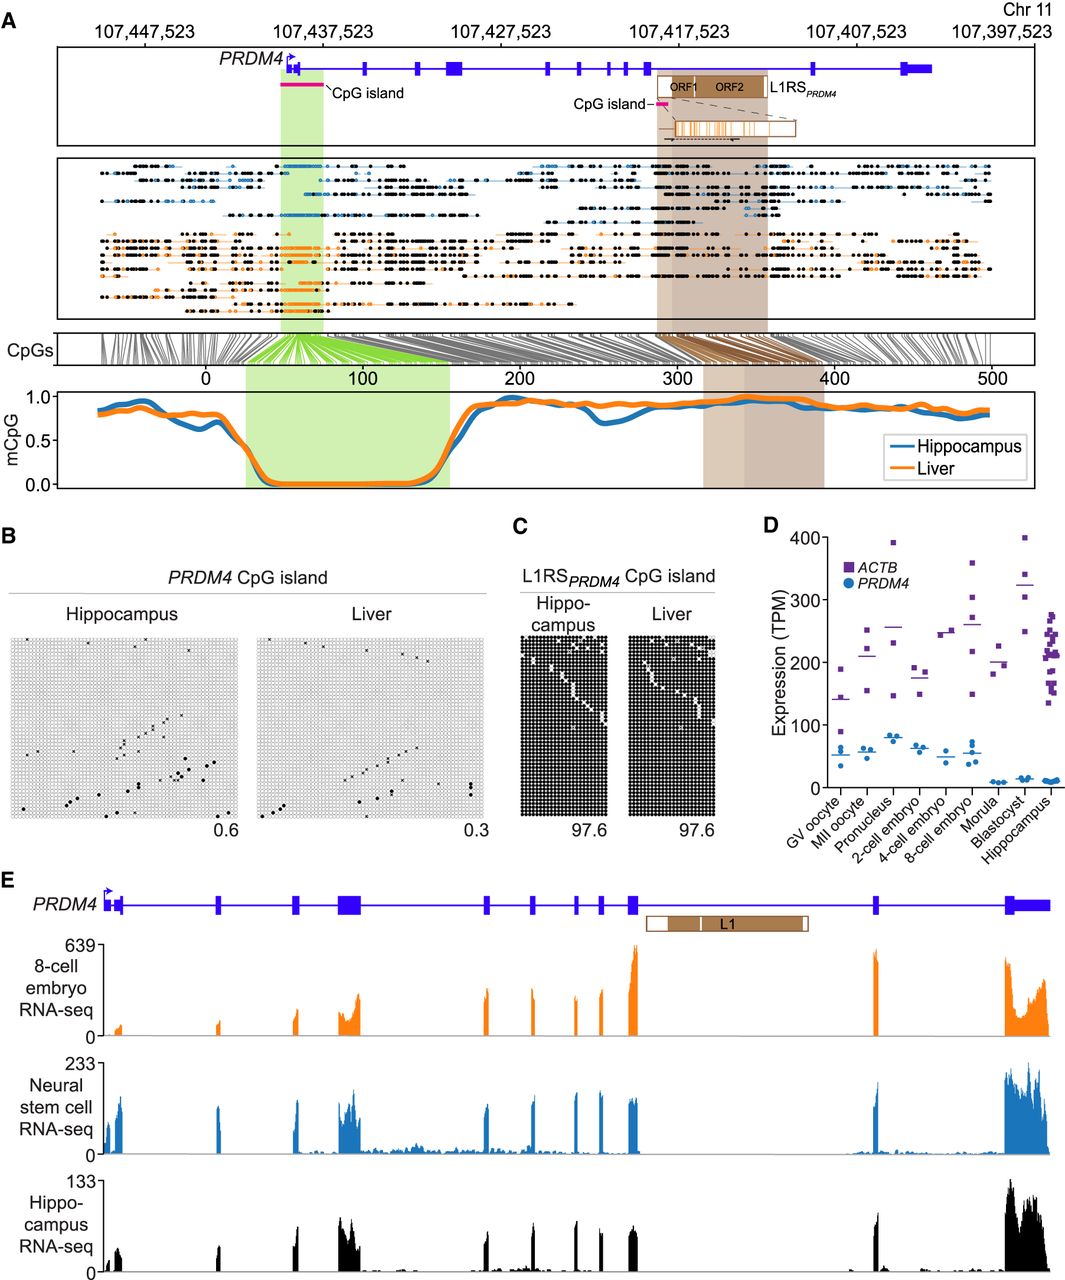
Regulation and embryonic expression of the PRDM4 locus. (A) Methylation profile of the PRDM4 locus obtained from ONT long-read sequencing (Ewing et al. 2020; Cheetham et al. 2022). The first panel shows L1RSPRDM4 oriented in sense to intron 10 of PRDM4, with genomic coordinates (rheMac10) provided, as well as a magnified view of the L1RSPRDM4 5′ UTR displaying CpG dinucleotides (orange lines) forming a CpG island (pink bar). The positions of primers used to assess L1RSPRDM4 methylation via locus-specific bisulfite sequencing in panel C are shown. The second panel displays animal ON22213 ONT read alignments, with unmethylated CpGs colored in blue (hippocampus) and orange (liver), and methylated CpGs colored black. The third panel indicates the relationship between CpG positions in genome space and CpG space, including those corresponding to the PRDM4 CpG island (shaded light green) and the L1RSPRDM4 5′ UTR and body (shaded light and dark brown, respectively). The fourth panel indicates the fraction of methylated CpGs for each tissue across CpG space. (B) Targeted bisulfite sequencing of the PRDM4 CpG island, as indicated in panel A, in animal ON22213 hippocampus and liver tissue. Each cartoon displays 50 nonidentical randomly selected sequences, where methylated CpGs (mCpGs) and unmethylated CpGs are represented by black and white circles, respectively, as well as the overall mCpG percentage. (C) As per B, except for the L1RSPRDM4 5′ UTR CpG island. (D) PRDM4 expression (blue circles) measured in RNA-seq tags per million (TPM) compared with that of the housekeeping gene ACTB (purple squares). Data were obtained from prior analyses of germinal vesicle (GV) and metaphase II (MII) oocytes, preimplantation embryo development stages (Wang et al. 2017), and adult hippocampus (Yin et al. 2020). Horizontal bars represent the mean of biological replicates. (E) Examples of PRDM4 expression during rhesus macaque development, showing WIG coverage tracks generated from published eight-cell embryo, neural stem cell, and hippocampus RNA-seq data sets (Zhao et al. 2014; Wang et al. 2017; Yin et al. 2020).


