
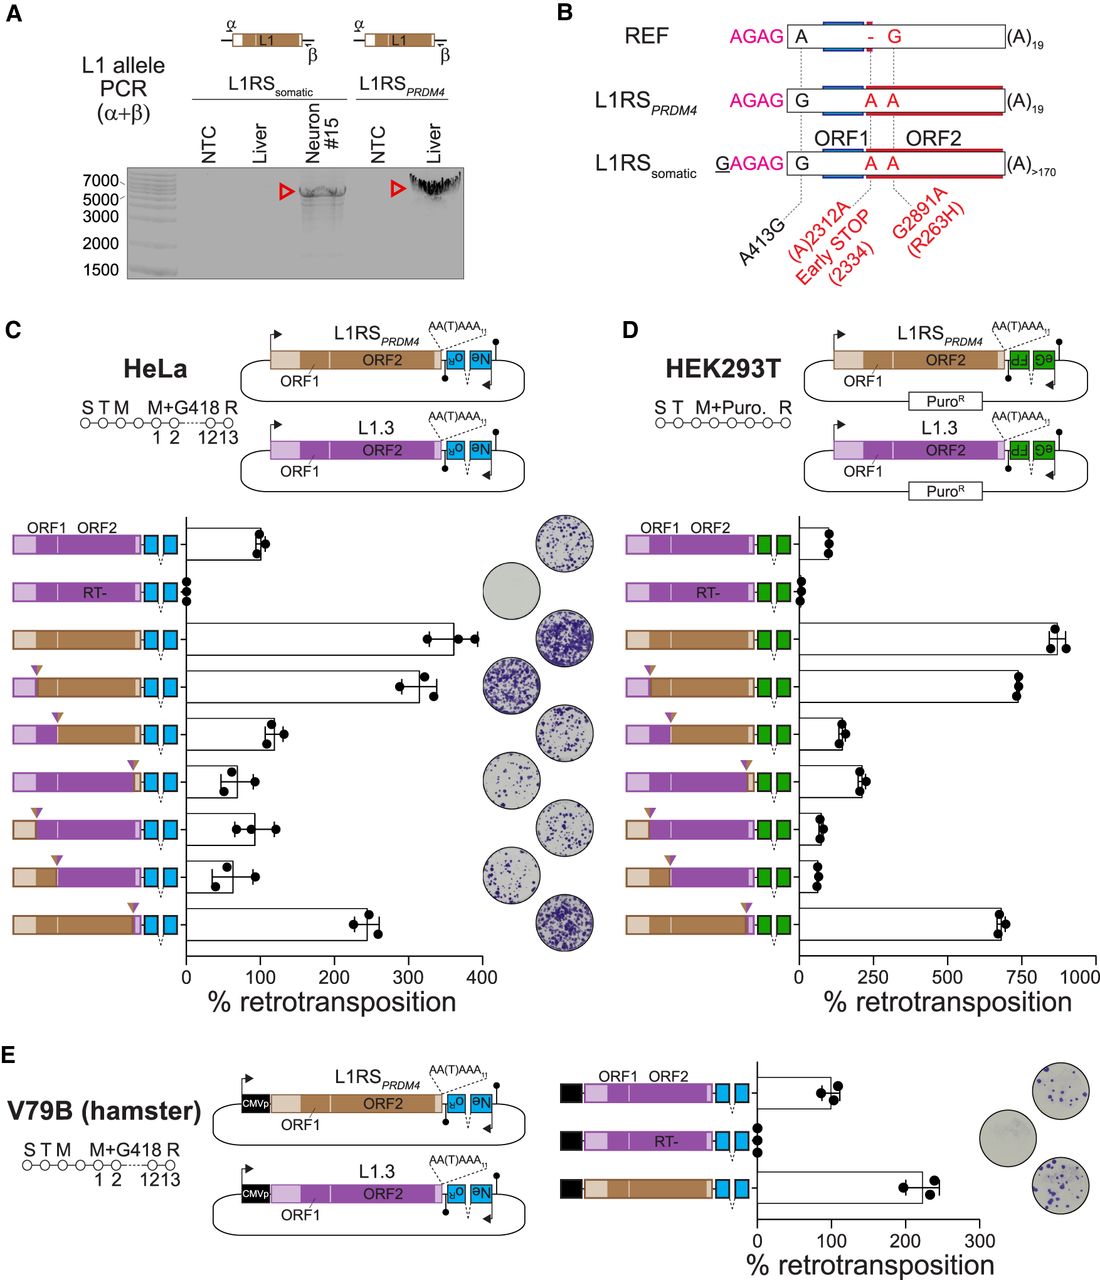
An endogenous L1 that is mobile in the macaque brain and in vitro. (A) The complete sequence of L1RSsomatic and its homozygous donor element, L1RSPRDM4, was amplified by PCR reactions (primers α + β) with input template DNA from ON22213 neuron #15 and bulk liver, respectively. Note that primer α spanned the 5′ junction of L1RSsomatic to more efficiently amplify the L1 allele. Red arrowheads indicate amplicons confirmed as on-target by capillary sequencing. (B) L1RSsomatic and L1RSPRDM4 were cloned and completely capillary-sequenced. Nucleotide variants among the reference (REF) genome L1RSPRDM4 sequence, the two identical L1RSPRDM4 alleles carried by animal ON22213, and the L1RSsomatic sequence are shown. Nonsynonymous mutations are highlighted in red. The 4-bp 5′ transduction (AGAG) carried by L1RSsomatic is colored in pink. (C) Engineered L1 retrotransposition efficiency measured in cultured HeLa cells (Moran et al. 1996). The assay design (top) shows either L1RSPRDM4 (brown) or L1.3 (purple), a highly mobile human L1 (Dombroski et al. 1993), tagged with a neomycin (G418)-resistance cassette activated only upon retrotransposition. (S) Seeding, (T) transfection, (M) change of media, (R) result analysis, (filled lollipop) polyadenylation signal. Numbers represent days of treatment with G418. AA(T)AAA indicates where a thymine base was removed to ablate the natural L1RSPRDM4 and L1.3 polyadenylation signals. Tested elements (bottom) included, in order, positive (L1.3) and negative (L1.3 RT−, D702A mutant) controls (Moran et al. 1996; Sassaman et al. 1997); L1RSPRDM4; a set of three chimeric elements where L1.3 was fused to L1RSPRDM4 at the 3′ end of the L1.3 5′ UTR, ORF1, and ORF2; and a set of three reciprocal elements where L1RSPRDM4 and L1.3 were joined at the 3′ end of the L1RSPRDM4 5′ UTR, ORF1, and ORF2 sequences. L1 expression was driven by native promoters only. Chimeric element fusion points are marked by inverted triangles. Representative well pictures are shown. Histogram values are normalized to L1.3 (100%). Data consist of three technical replicates and their mean ± SD, obtained from one representative experiment of three independent biological replicates. (D) As per C, except assayed in HEK293T cells using an EGFP-based L1 reporter system (Ostertag et al., 2000) in which cells are selected for puromycin resistance, and retrotransposition efficiency is measured as the percentage of EGFP+ sorted cells. (E) As per C, except with the inclusion of a cytomegalovirus promoter (CMVp) to additionally drive L1RSPRDM4 and L1.3 expression, as well as testing in the Chinese hamster fibroblast V79B cell line.


