
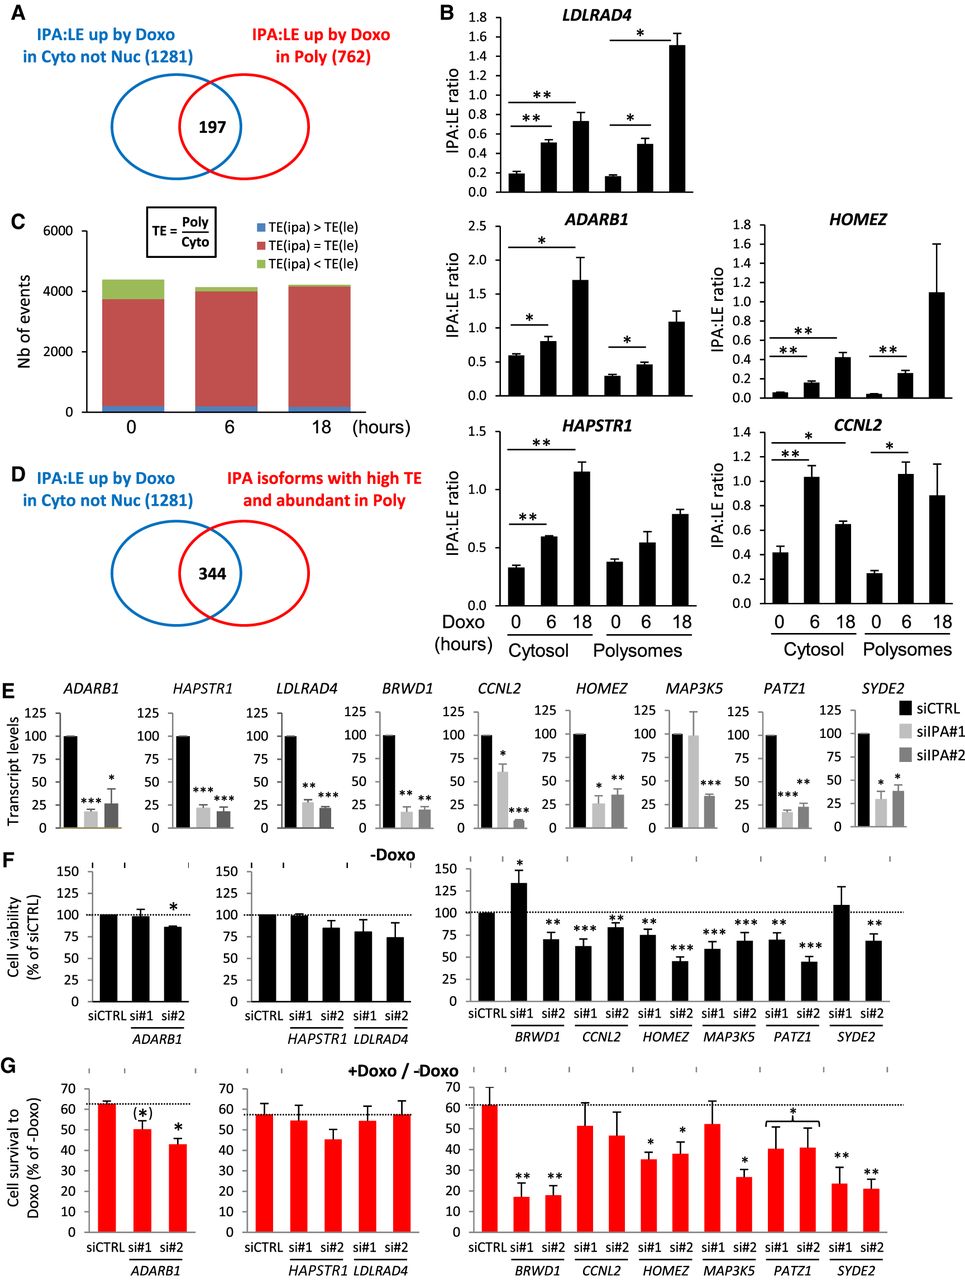
Identification and function of Doxo-up-regulated IPA isoforms that are highly translated. (A) Venn diagram comparing IPA:LE up-regulation events by Doxo in the cytosol (not nucleus) and in polysomes, at either 6 or 18 h of Doxo treatment. (B) RT-qPCR analysis of IPA:LE isoform ratio regulation by Doxo in the indicated genes in the cytosol and polysomes at 0, 6, or 18 h of Doxo treatment. The data represent the relative abundance of IPA to LE isoforms. (C) Relative translation efficiency (TE), that is the polysome to cytosol ratio of abundance, of IPA and LE isoforms measured by 3′-seq at 0, 6, or 18 h of Doxo treatment. Only IPA isoforms whose abundance equalizes at least 5% of matched LE isoforms are shown. (D) Venn diagram comparing IPA:LE up-regulation events by Doxo in the cytosol to IPA isoforms that have a high TE and are at least 25% as abundant as matched LE isoform in polysomes at either 0, 6, or 18 h of Doxo treatment. (E–G) Effects of siRNAs targeting IPA isoforms of the indicated genes in MCF-7 cells. Two independent siRNAs (siIPA#1 and #2) were tested for each isoform. In panels E and F, the data in the presence of a negative-control siRNA (siCTRL) were set to 100%. The statistical tests are comparing siIPA data to siCTRL data. (E) Effects of siRNAs on IPA isoform abundance, as measured by RT-qPCR and normalized to TBP levels. (F) Effects of siRNAs on cell viability in the absence of Doxo, as measured by WST-1 assay. (G) Cell survival to Doxo, as measured by cell viability in the presence of Doxo normalized to cell viability in the absence of drug. For PATZ1, P-value is below 0.05 when combining data from both siRNAs. (*) P = 0.06; (**) P < 0.01; (***) P < 0.001.


