
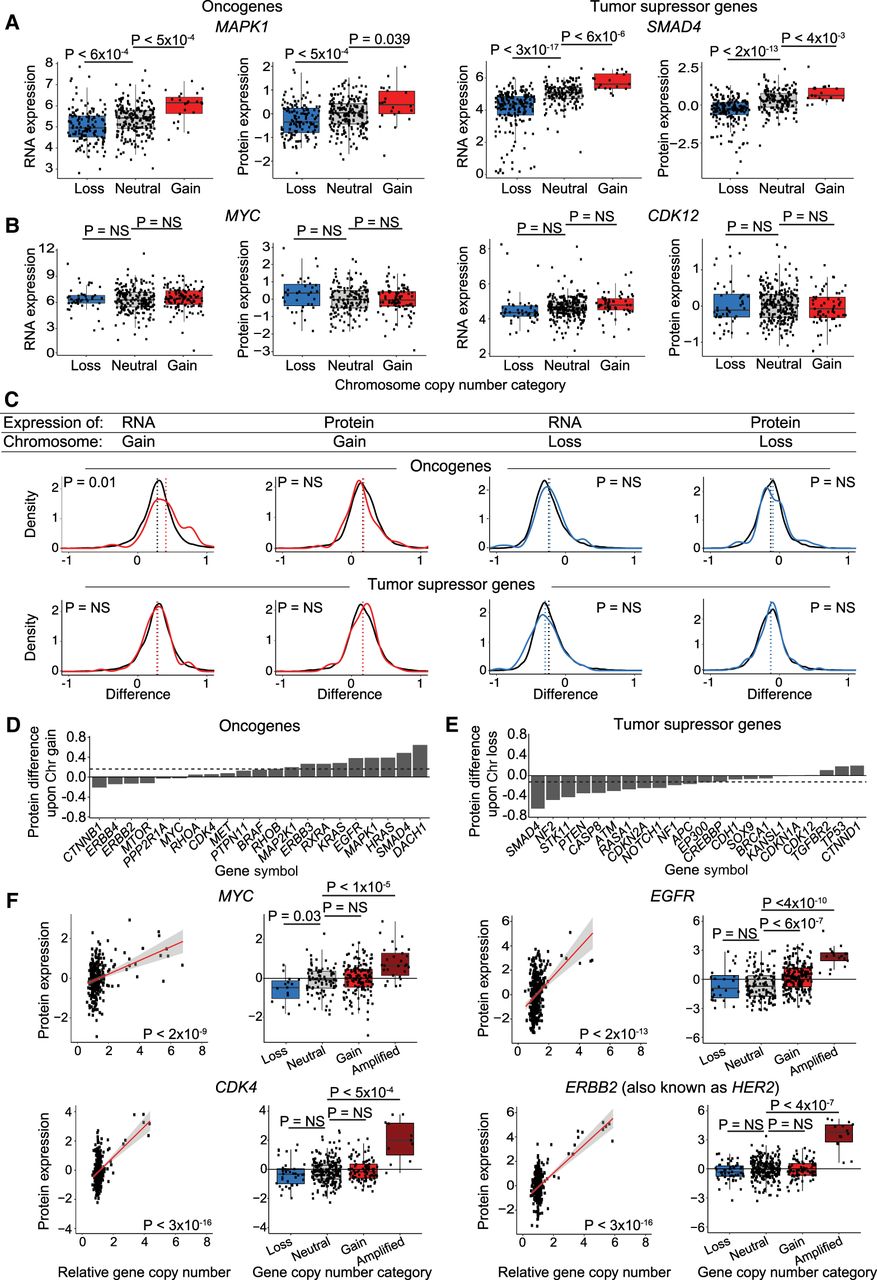
OGs and TSGs can be buffered upon chromosome gain or loss, though some OGs scale with gene copy number amplifications. (A,B) Boxplots displaying RNA and protein expression differences upon chromosome gain and loss for OGs (left) and TSGs (right). Boxplots display the 25th, 50th, and 75th percentiles of the data, and the whiskers indicate 1.5 interquartile ranges. P-values represent two-sided t-tests. (C) Density curve of OG and TSG expression at the RNA level and protein level upon chromosome gain (red) or chromosome loss (blue). Difference in expression for all other genes is displayed in black. Mean expression differences per condition and gene group are labeled by dotted lines. P-values are from two-sided t-tests between the indicated gene group and the background set of all other genes. The list of all OGs and TSGs used is in Supplemental Table S6. (D,E) Bar graphs displaying the mean protein expression difference for OGs upon chromosome gain (D) and TSGs upon chromosome loss (E). Not all OGs and TSGs are displayed. Dotted lines indicate the mean differences in expression for all genes. The complete list of OG and TSG expression differences upon chromosome gain and loss are available in Supplemental Table S2. (F) Scatterplots and boxplots displaying protein expression levels for four OGs, MYC, EGFR, CDK4, and ERBB2 (also known as HER2), relative to their gene copy number. Linear regressions (red) with 95% confidence intervals (gray) are plotted against the data. P-values in the scatterplots were calculated from the Pearson correlation coefficient, and P-values in the boxplots were calculated from two-sided t-tests.


