
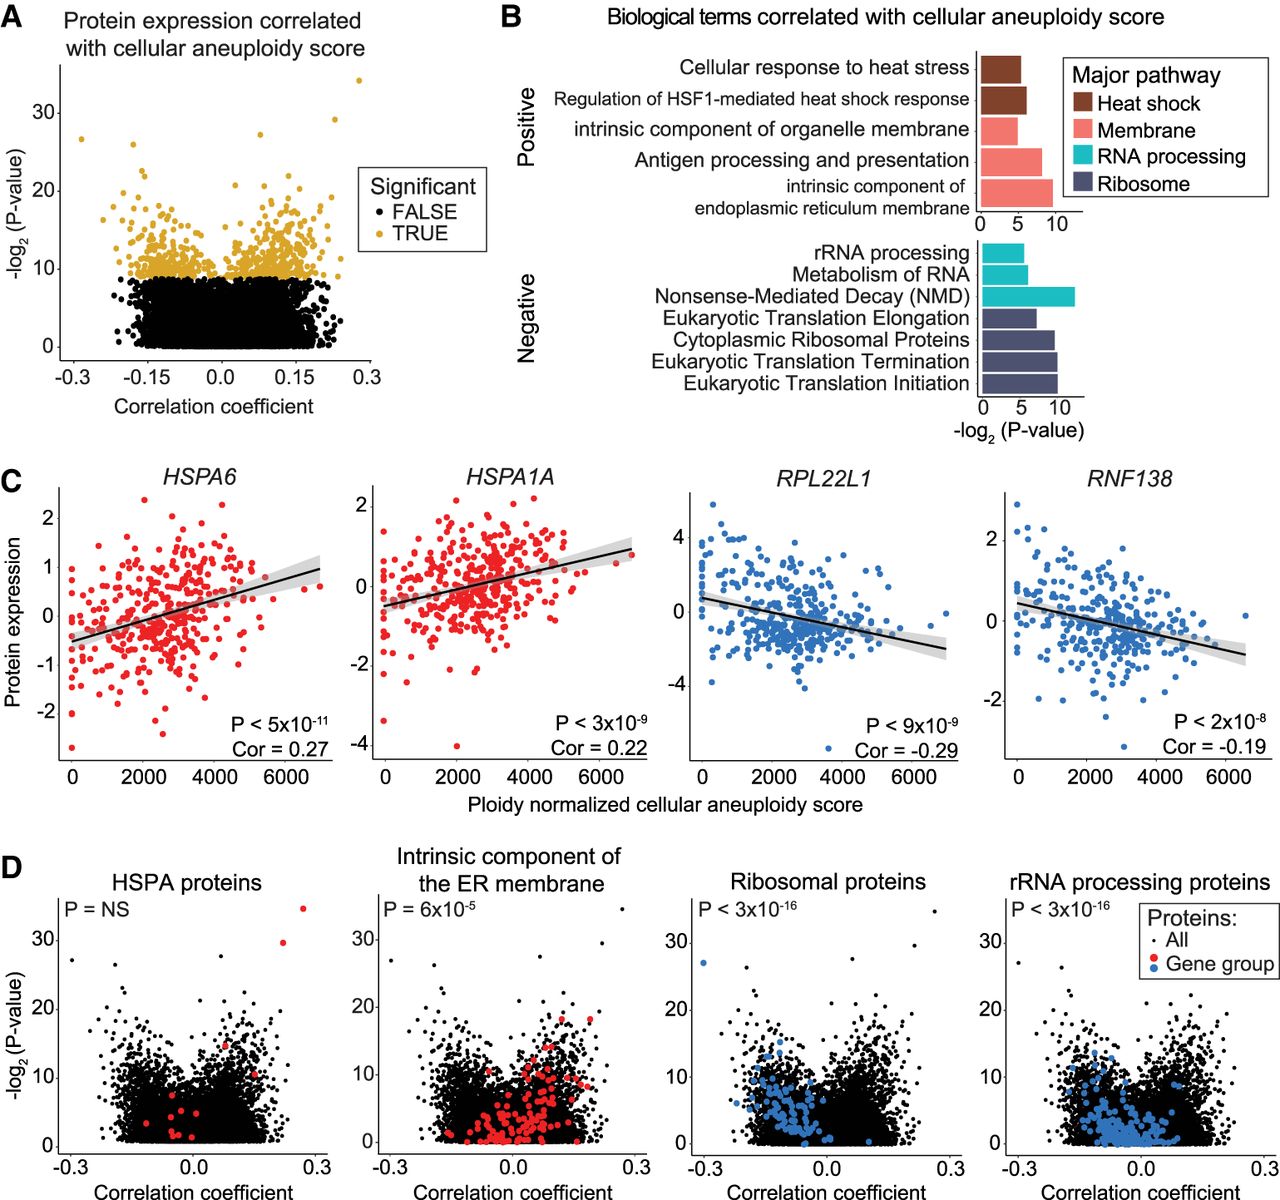
Specific protein expression levels correlate with total cellular aneuploidy. (A) A volcano plot displaying the Pearson correlation coefficient between protein expression levels and cellular aneuploidy score versus the P-value for that comparison. Genes that are significant at a P < 0.05 threshold after Benjamini–Hochberg correction with a 5% FDR are labeled in gold. (B) A bar graph displaying the GO terms that are enriched among genes positively (top) or negatively (bottom) correlated with total cellular aneuploidy. The complete list of GO terms is included in Supplemental Table S10. (C) Scatterplots displaying the expression of the two proteins that are most significantly positively correlated with aneuploidy score (left) and the two proteins that are most significantly negatively correlated with aneuploidy score (right). Protein expression is plotted by cellular aneuploidy score. Pearson correlation coefficients and P-values are displayed. Linear regressions and 95% confidence intervals are plotted against the data. (D) Volcano plots displaying the correlation coefficient between protein expression and cellular aneuploidy score versus the corresponding P-value. The background set of all genes are plotted in black, and genes belonging to indicated groups are labeled in red or blue. P-values correspond to two-sided t-tests between correlation coefficients of gene groups and all other genes. The list of genes in gene groups is in Supplemental Table S6.


