
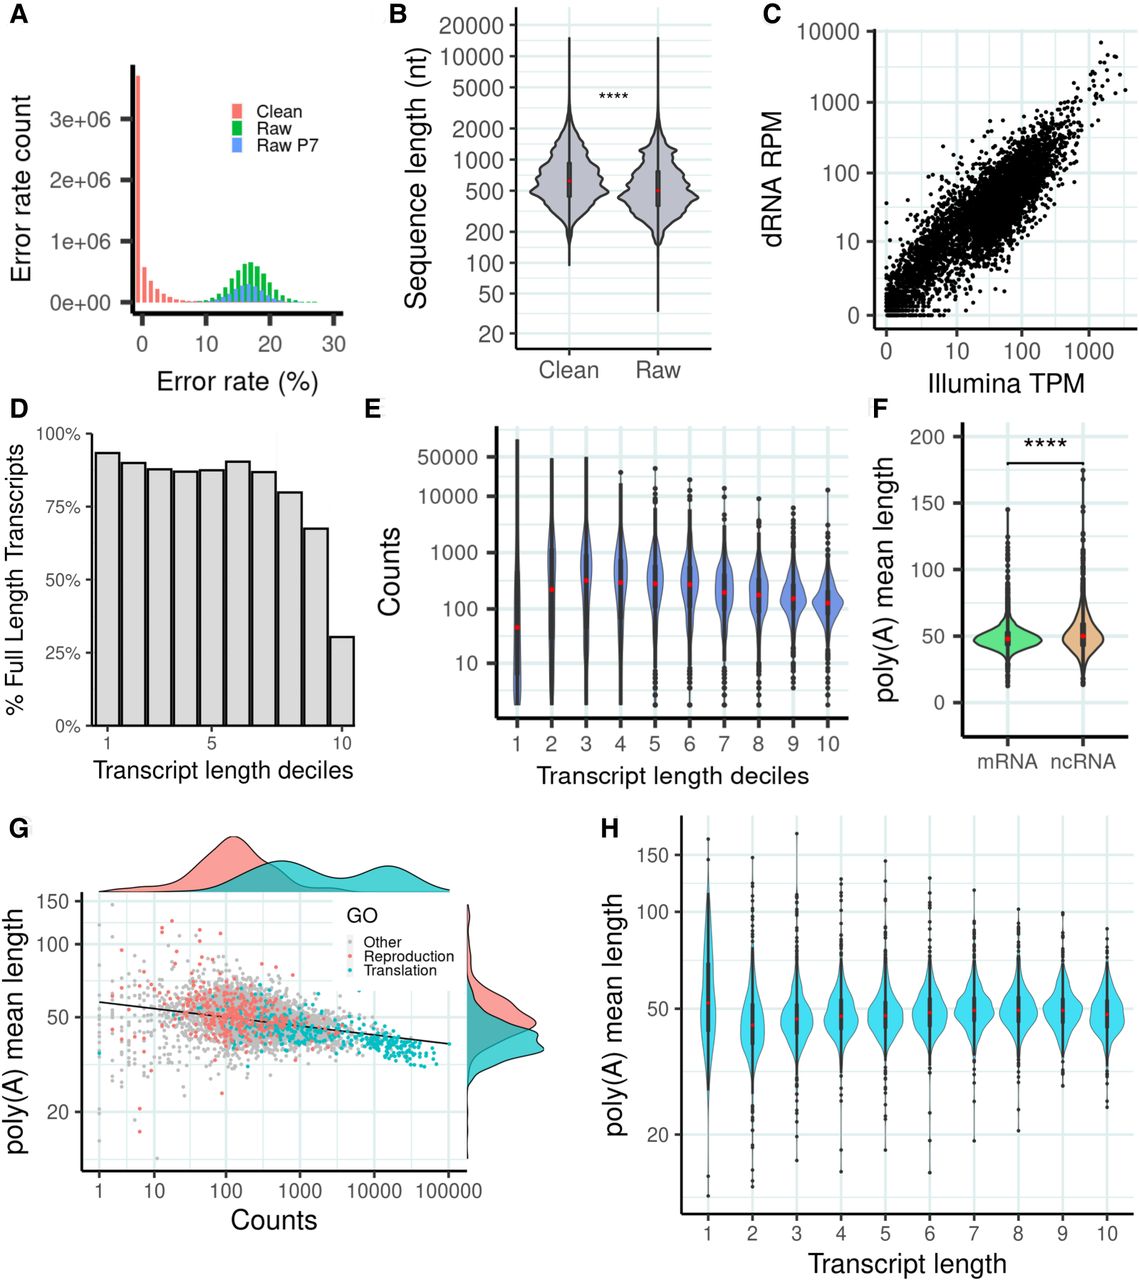
dRNA sequencing (dRNA-seq) of S. pombe. (A) Error rate distribution of raw and clean reads. Error rate is the percentage of aligned positions that contain a mismatch or indel. (Raw) The original reads, (raw P7) original reads with quality score Q ≥ 7, and (clean) corrected reads used in this work. (B) Sequence length distribution of raw and clean reads. Number of raw reads, 7,097,130; number of clean reads, 5,054,233; median value raw reads, 500; and median value clean reads, 620. Differences in the distribution are significant by a Wilcoxon test (P-value < 2.2 × 10⁻¹⁶). (C) Correlation transcript abundance ONT dRNA versus Illumina. The reads were mapped to the PomBase transcriptome. In the case of dRNA reads, we simply divided the number of reads by the number of million reads (reads per million [RPM]). For Illumina reads, we calculated transcripts per million (TMP), normalizing by transcript length as well as number of million reads. We selected transcripts expressed in at least one of the two data sets; transcripts with multimapping Illumina reads were removed. Number of transcripts analyzed was 4999. (D) Estimated number of transcripts with at least one full-length read with respect to transcript length. The data are shown for different transcript length deciles: (71.0–633.2), (633.2–923.4), (923.4–1175.0), (1175.0–1395.0), (1395.0–1637.0), (1637.0–1911.2), (1911.2–2227.4), (2227.4–2695.0), (2695.0–3444.6), (3444.6–15,022.0]. Number of transcripts was 6453. (E) dRNA counts with respect to transcript length. Bins are the same as in D. (F) Poly(A) tail distribution in mRNAs and ncRNAs. Poly(A) tail is estimated as the mean of the poly(A) tail length of all the reads that map to each transcript. Differences are significant according to a Wilcoxon test (P-value < 10−5). (G) Relationship between poly(A) tail length and transcript abundance. For each transcript, the average poly(A) tail length of all the reads mapping to the transcript is taken. Only mRNAs are taken into account for this calculation (n = 4995). Genes related with reproduction (GO:0000003) and translation (GO:0006412) are highlighted. Highly expressed transcripts tend to have shorter poly(A) tails. The correlation is significant (Spearman's ρ = −0.376; P-value = 9.3 × 10−168) (H) Distribution of poly(A) tail length with respect to transcript length. Bins are the same as in D. Poly(A) tail length is homogeneously distributed across different transcript length classes.


